

Gold trading can generate gains or losses. But a single profitable trade is not the same as a profitable long-term strategy, and neither establishes a predictable income. The outcome depends on the instrument, the actual price change, how much exposure is taken, execution costs and the distribution of winning and losing trades. No particular monthly return or timeline to profitability can responsibly be assumed for a beginner.
Different products, different risks
| Instrument | Nature of exposure | Main costs and risks |
|---|---|---|
| Physical bullion | Ownership of coins or bars | Premiums, storage, resale spreads |
| Gold-linked fund | Fund shares or units | Market risk, fund expenses, tracking |
| Exchange gold futures | Standardised futures contract | Margin, expiry, commissions, losses |
| OTC gold CFD | Contract with a CFD provider | Leverage, spread, funding, counterparty |
A hypothetical gross versus net trade
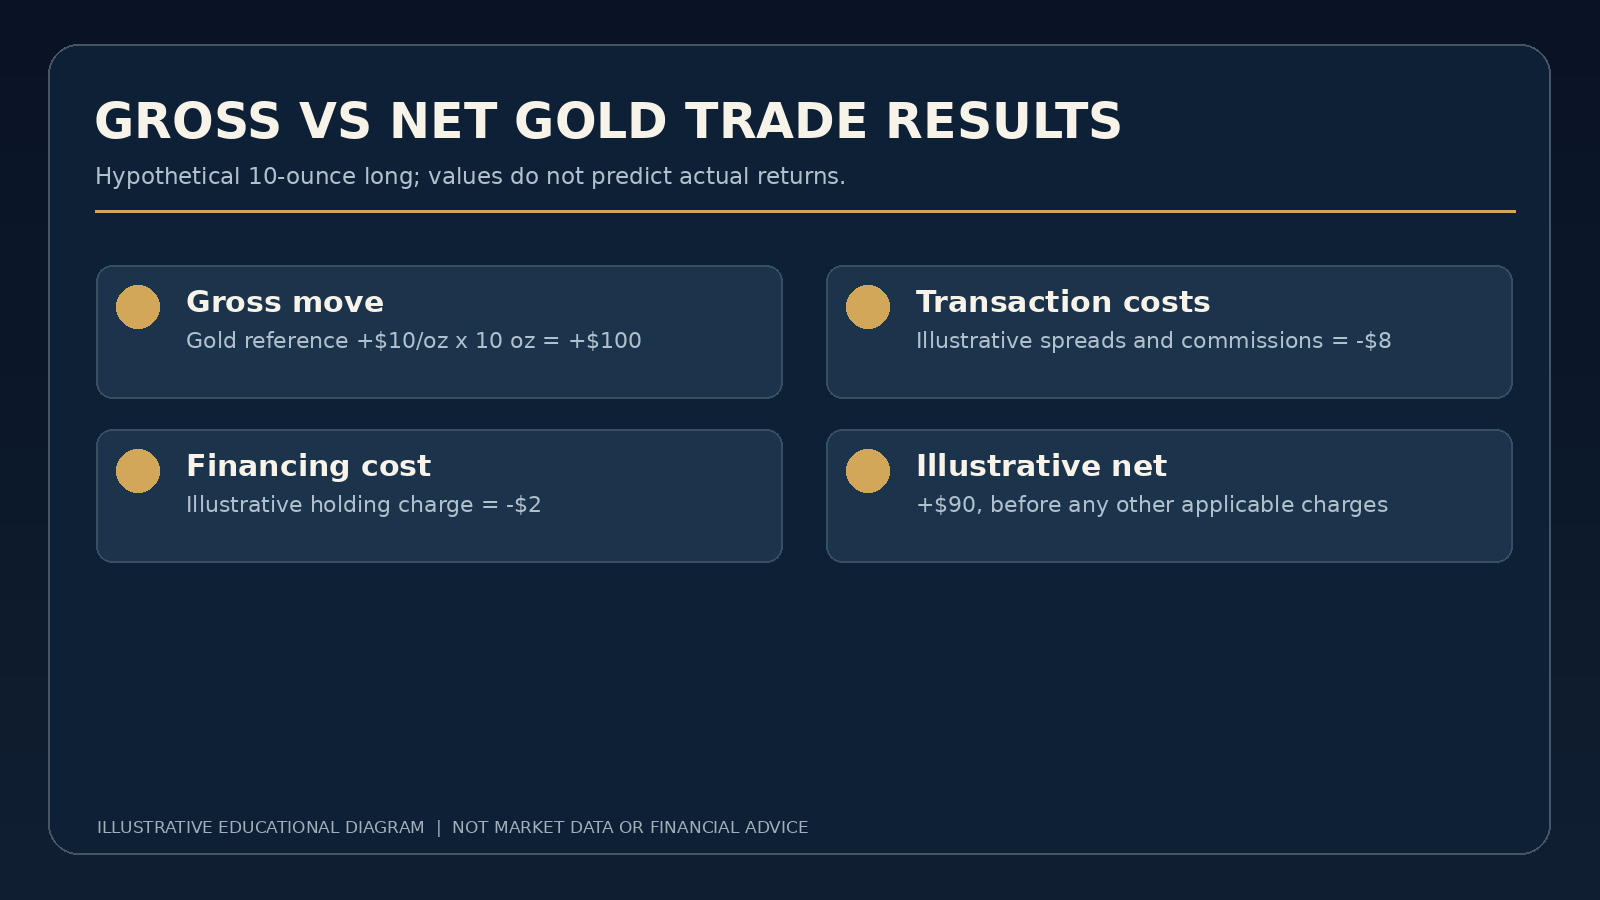
Suppose a hypothetical long gold CFD represents 10 troy ounces. The assumed entry reference price is $2,000/oz and the relevant closing price is $2,010/oz. Before costs, the $10/oz price move yields +$100. If the total applicable spread and commissions add up to $8 and holding finance to $2, the illustrative net amount is +$90. Real quotations, costs and position specifications vary.
| Calculation | Hypothetical USD amount |
|---|---|
| Gross price movement | 10 oz × $10/oz = +$100 |
| Spread/commissions | −$8 |
| Financing | −$2 |
| Illustrative net result | +$90 |
If gold instead moves $10/oz against the same exposure, the gross loss would be $100 before charges. An unfavourable stop fill could increase it further. The MoneySense CFD guide explains financing, margin, and non-guaranteed stop execution.
What about strategies with winning percentages?
Suppose a fictional strategy wins 40% of trades with average gross winner $150, loses 60% with average gross loss $75 and incurs average $8 costs per trade. Its estimated net expectancy is 0.4 × $150 − 0.6 × $75 − $8 = +$7 per trade over the assumed distribution. It is not evidence that such a strategy exists, will persist or cannot experience catastrophic losses.
Why advertised monthly returns are misleading
Statements such as ‘day traders typically earn 5–15% each month’ cannot be derived from a trading style label. Outcome distributions, different starting balances, survivorship bias and unusually successful examples make such claims unreliable. A strategy with attractive recent results can also lose after spreading, adverse slippage or market regime changes.
How to evaluate a trading record
- Verify every position using broker statements and calculate net outcomes after spreads, commissions and financing.
- Measure returns against total account equity, not merely initial margin.
- Assess worst losses, drawdowns, losing streaks and exposure to major gaps.
- Check whether reported performance survives unseen periods rather than using selected examples.
- Keep personal household expenses separate from speculative trading funds.
Is gold trading suitable for beginners?
Leveraged short-term trading can be especially demanding and carries the possibility of significant losses. Investor.gov’s day-trading risk discussion explains why high-frequency and leveraged strategies may be unsuitable for people without sufficient financial capacity and experience. A demo account is useful for learning platform mechanics but cannot guarantee live trading outcomes.
Key takeaway
Gold price fluctuations create the possibility of gain and loss, not an expected paycheck. Evaluate strategies through verified, cost-aware records and remember that declining to trade is an option.
Continue learning
Sources
Educational information only. Financial examples are hypothetical and do not establish an expected return or personal financial recommendation. Leveraged gold products can cause significant losses.