

Advanced charting tools make it easier to organise historical gold prices, but a larger collection of overlays does not necessarily create a better forecast. Fibonacci levels, Bollinger Bands and Ichimoku indicators are mostly transformations or selections of observed prices. They should be treated as reproducible hypotheses rather than privileged access to institutional order flow.
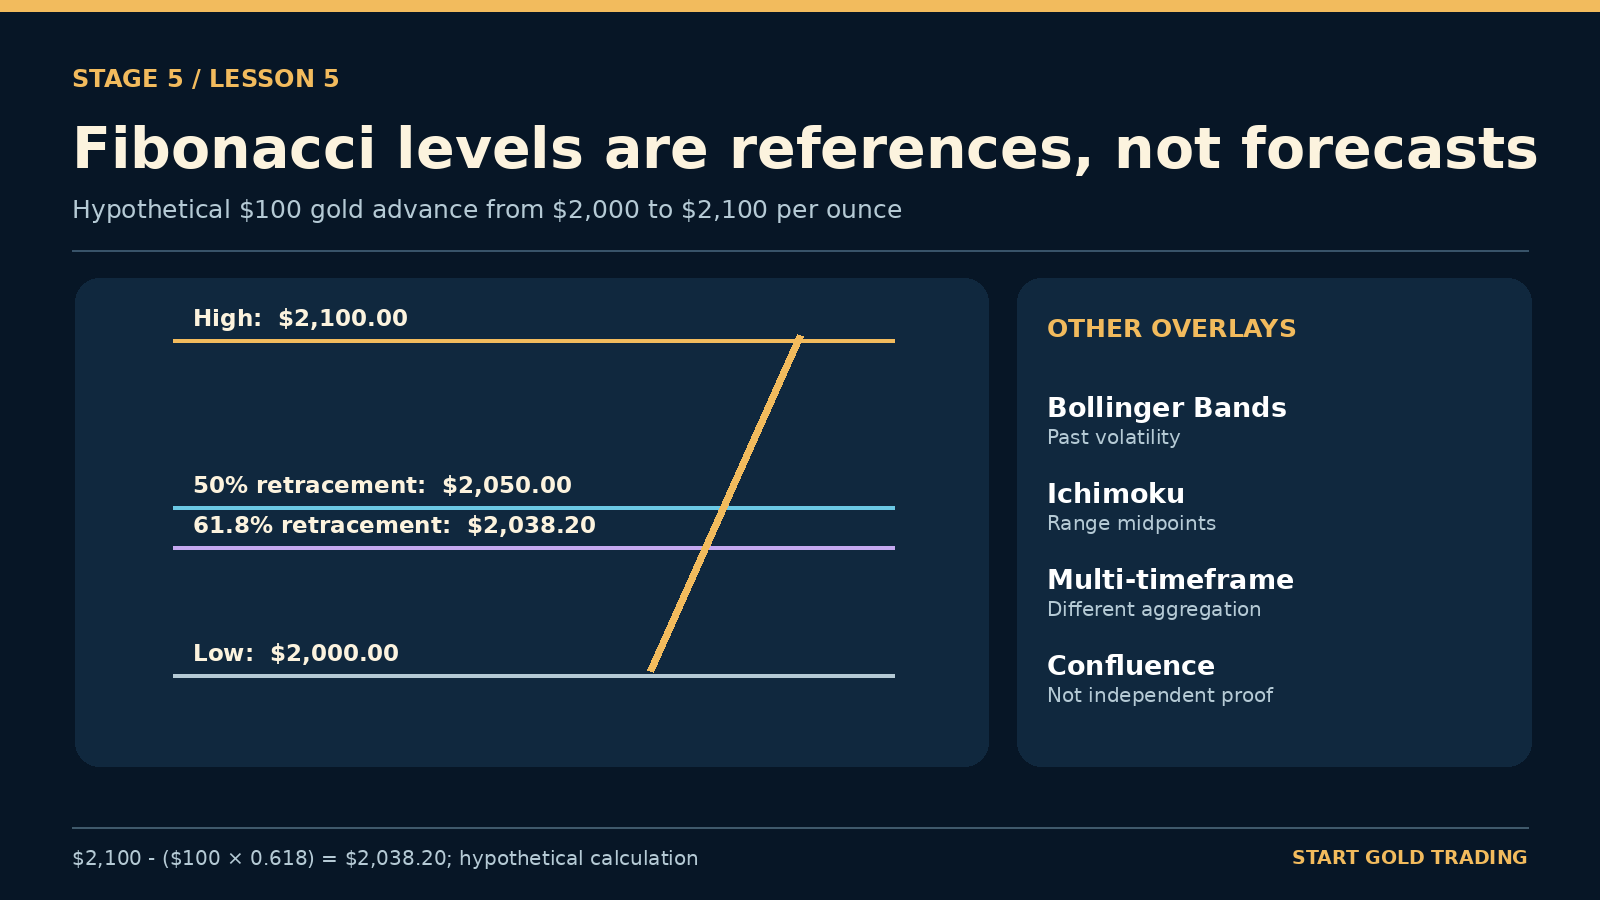
Fibonacci retracement: a chosen range, not a law
Fibonacci retracement levels divide a selected price move into conventional fractions such as 38.2%, 50% and 61.8%. The 50% level is a widely used midpoint convention, not a Fibonacci ratio. The start and end of the move are selected by the analyst and can vary considerably. These prices are candidate reference levels, not proven barriers.
Hypothetical example: if gold moved from $2,000 to $2,100 per ounce, the 50% midpoint of that $100 move is $2,050. A 61.8% retracement of the advance corresponds to $2,038.20 ($2,100 − $61.80). There is no rule that price must stop there.
Bollinger Bands: relative volatility
A standard Bollinger Band setup commonly uses a 20-period moving average with upper and lower bands offset by two times a rolling standard deviation. When the underlying observations are dispersed, bands tend to widen; when less dispersed, they contract. Touching a band does not itself mean the market is overbought or guaranteed to reverse.
Ichimoku: multiple historical ranges
Ichimoku combines selected price-range midpoints, typically including a 9-period conversion line, 26-period base line, and leading spans often displayed forward on the chart. Forward displacement is a plotting convention and does not mean the indicator has measured future prices. Settings and alignment must be handled carefully in backtests to avoid look-ahead bias.
Why confluence can be misleading
If Fibonacci, moving averages, Bollinger Bands and Ichimoku all mark a similar level, that may simply reflect common inputs and a visible recent range. They are not independent measurements of large bank orders. Testing should compare a multi-indicator rule with a simpler baseline to determine whether complexity helps after costs.
Multiple timeframes and data consistency
- Daily and hourly candles use different aggregation and can give different apparent trends.
- Spot gold CFDs may use provider-specific bid/ask or indicative quotes; futures are exchange-traded contracts.
- Futures expiry and rollovers can introduce discontinuities if data is stitched incorrectly.
- Indicators can repaint visually if values from unfinished candles or future-aligned spans are mishandled.
- Chart volumes in one OTC dealer feed do not equal global gold transactions.
An explicit research checklist
- Fix the exact instrument, data vendor, quote convention and timezone.
- Specify the indicator parameters and all anchor-point rules in advance.
- Use only data that was available when the hypothetical decision would have occurred.
- Measure entries, exits, trading costs, false signals and worst drawdown.
- Compare with a baseline using unseen out-of-sample periods.
- Test under multiple volatility regimes and explain when the strategy fails.
Worked validation question
Suppose a Fibonacci midpoint overlaps a Bollinger Band boundary. Instead of assuming increased reversal probability, compare how often similar overlaps occurred historically, what happened afterward net of trading costs, and whether results persist in a later unseen sample. CFA Institute’s backtesting guidance explains how this process can help avoid misleading simulations.
Key takeaway
More sophisticated drawings can help describe a market. They are not inherently more predictive; what matters is clear definitions, the quality of the underlying data, and independent evidence.
Sources
Continue learning
- Gold Trading for Beginners — Five-Stage Learning Guide
- Gold Seasonality: Are Monthly Patterns Reliable?
- Gold Automated Trading: Benefits and Risks
Educational content only; not personal investment advice. All examples are hypothetical unless explicitly identified as dated historical research. Leveraged gold products involve substantial risk.