

Evaluating a gold trading strategy is not the same as counting how often it wins. A system that wins frequently may lose money because its losses are larger, and one with fewer winners may be profitable in a specific sample. The important starting points are net results after costs, uncertainty, drawdowns and whether the rule survives unseen data.
Define the strategy before measuring it
Specify the instrument, price feed, timeframe, entry rule, exit rule, sizing convention and session restrictions. Define whether ‘return’ is calculated on total account equity, margin deposited or notional exposure. Do not mix these bases or count a paper result as a live return.
A hypothetical expectancy calculation
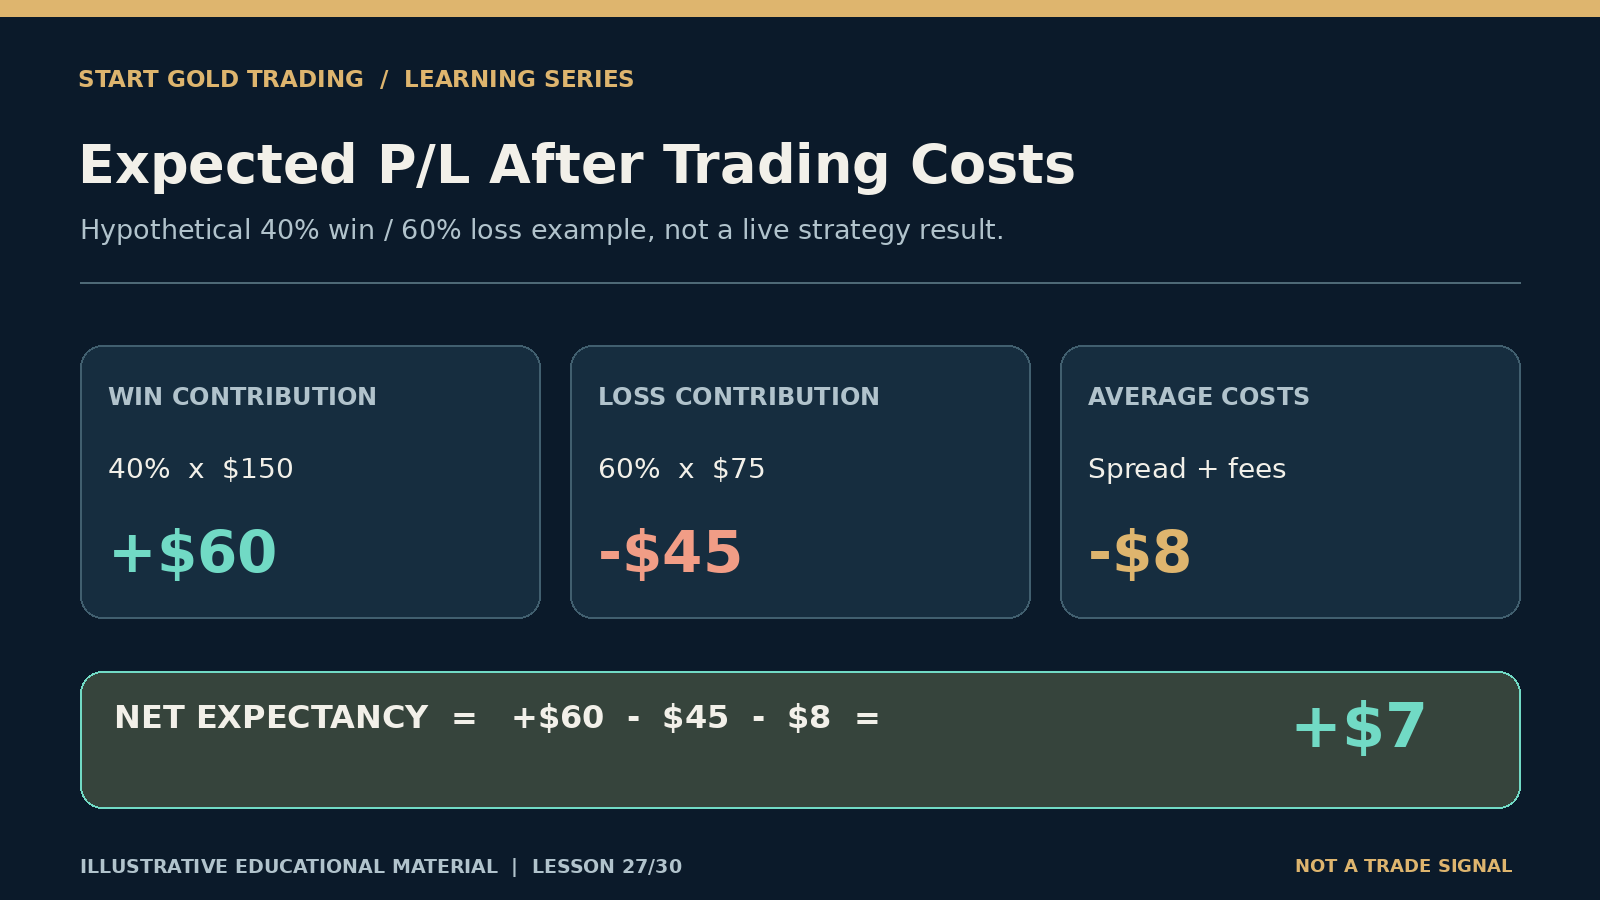
Consider an illustrative strategy with a 40% win rate, average winning trade of $150, average losing trade of $75, and average all-in costs of $8 per trade. Assume the average win and loss figures are measured before those costs.
| Measure | Value |
|---|---|
| Probability of win | 40% |
| Average gross winner | +$150 |
| Probability of loss | 60% |
| Average gross loser | −$75 |
| Gross expectancy per trade | (0.40 × $150) − (0.60 × $75) = +$15 |
| Estimated costs per trade | $8 |
| Net illustrative expectancy | +$15 − $8 = +$7 |
A hypothetical positive average is not evidence of future profitability. It can hide rare extreme losses, missed stops, different position sizes, changes in spread, and small sample uncertainty. Realised results may be negative even when an estimate is positive.
Five metrics to evaluate together
- Net P/L: after spread, commission, financing, slippage and relevant currency costs.
- Win rate and payoff ratio: realised winners versus losers, with their average sizes.
- Drawdown: decline from a prior equity peak to a later trough, measured consistently.
- Distribution and tail risk: worst individual losses, largest losing clusters and exposure to gaps.
- Sample and regime coverage: number of independent trades, trend versus range conditions and how strategy rules were selected.
Drawdown recovery arithmetic
If an account declines from $10,000 to $8,000, drawdown is 20%. Returning from $8,000 to $10,000 then requires a 25% gain. Evaluate whether a strategy’s drawdown could be tolerated in real trading, especially if positions use leverage or have correlated exposure.
Why impressive backtests may fail
Testing many parameter combinations and reporting only the winner is a form of selection bias. Look-ahead bias occurs when a rule uses data unavailable at the time of the hypothetical trade. Unrealistically favourable fills, excluded commissions and price-feed differences can also distort outcomes. CFA Institute discusses backtesting, simulation and changing regimes.
A controlled review process
- Write a strategy definition and freeze the rule for the planned evaluation period.
- Keep training and later evaluation periods separate.
- Measure gross and net results, realised execution and all-in costs.
- Study both favourable and adverse regimes and include skipped trades.
- Review repeated observations, not a single losing streak or successful week.
- If changing one rule, record the reason and test it on another unseen sample.
Avoid overreacting to recent trades
A few recent wins or losses can occur by chance. Changing every parameter after a small sample raises the probability of fitting noise. Meaningful strategy evaluation combines statistical humility, position-risk limits and transparent reporting, not a universal 1:3 target.
Key takeaway
A strategy deserves trust only to the extent its full, cost-aware record supports the claim. Track uncertainty, tail losses and unseen periods—not just its best chart.
Sources
Continue learning
- Gold Trading for Beginners — Five-Stage Learning Guide
- Automated Gold Trading: Bots, Testing and Risks
- Gold Trading Journal: Practical Review
Educational information only. Market scenarios and calculations are hypothetical unless explicitly sourced. Gold and leveraged derivatives can involve substantial losses. This article is not personal investment advice.