Candlesticks summarise a defined period’s open, high, low and close (OHLC). They are widely used to display gold charts because the candle body and wicks are easy to compare. A bullish-looking candle is an observation about price, not a transcript of orders or a guaranteed signal of the next direction.
Anatomy of a candle
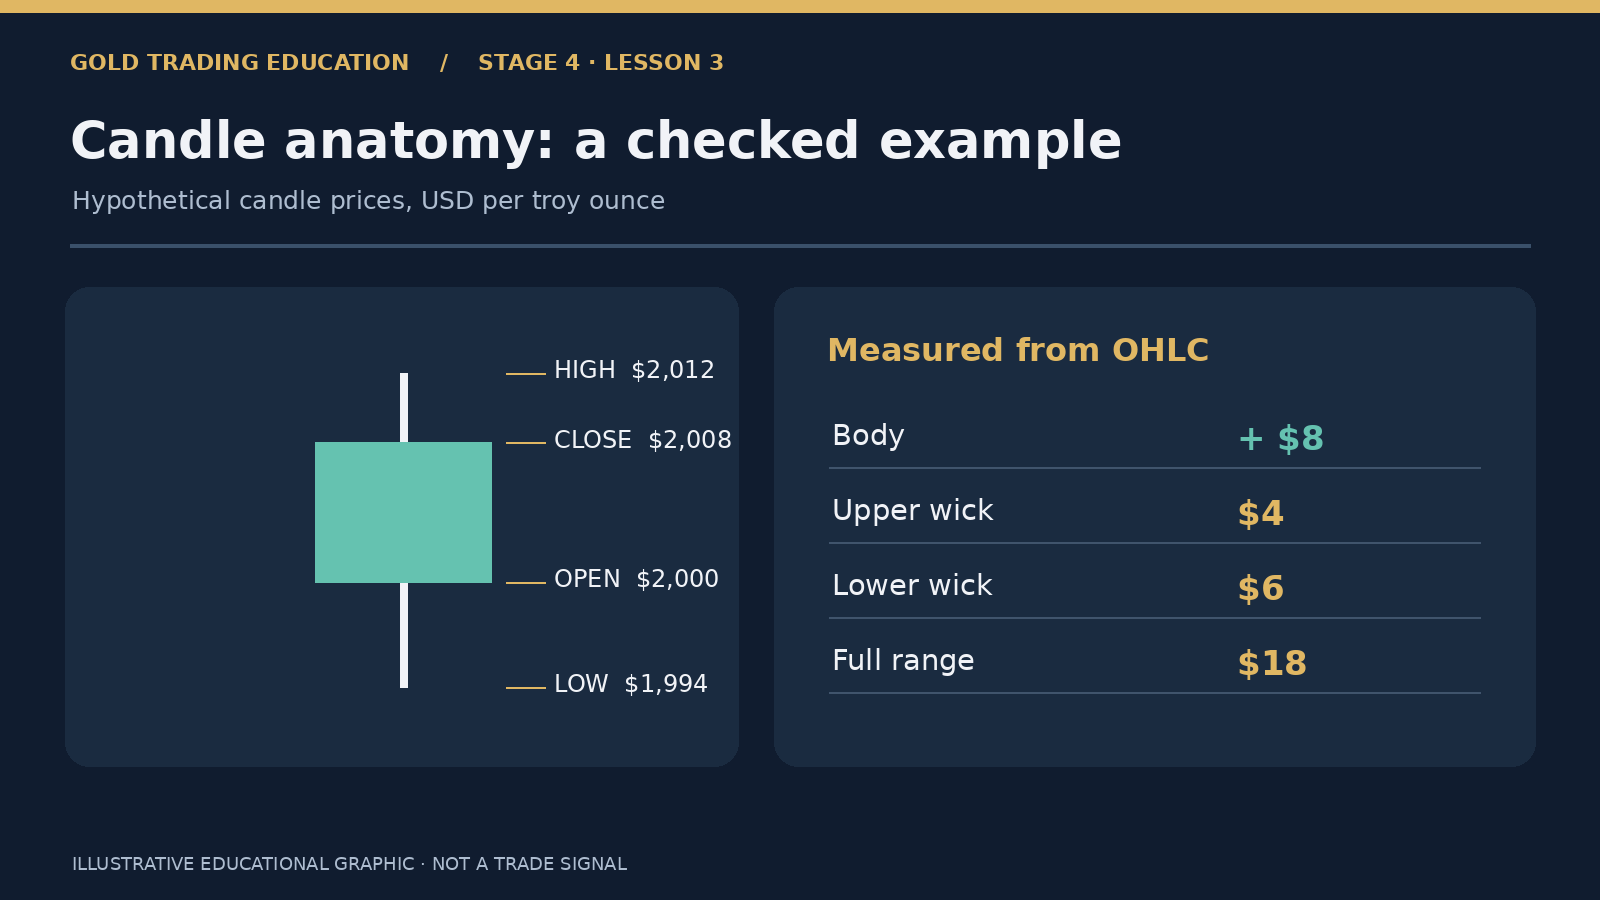
A candle body spans its open and close. Its top and bottom wicks show the highest and lowest observed prices for the interval. Most platforms colour candles differently depending on whether close exceeds open; colour schemes can be customised. Data may be based on broker quotes or exchange trades.
A checked hypothetical gold candle
| OHLC field | Hypothetical USD/oz |
|---|---|
| Open | $2,000 |
| High | $2,012 |
| Low | $1,994 |
| Close | $2,008 |
This would be an upward candle with an $8 body ($2,008 − $2,000), an $4 upper wick ($2,012 − $2,008), a $6 lower wick ($2,000 − $1,994), and an $18 full range ($2,012 − $1,994). These hypothetical numbers illustrate construction only, not an observed trading day.
What common pattern names describe
- Doji: an open and close that are very close; threshold depends on the analyst and instrument.
- Hammer-like candle: a small body near the top of a candle’s range with a comparatively long lower wick.
- Engulfing: a two-candle pattern in which one body covers the prior body under a chosen definition.
- Inside bar: the later candle’s range lies inside the previous candle’s range, using the selected data source.
Why pattern names cannot reveal who traded
A wick may result from changing quotes, aggressive trading, temporary liquidity gaps, or different data-feed construction. It does not show an identified bank, a precise order book imbalance or the intent of an institutional participant. An identical-looking candle may form in two different ways within the interval, because OHLC omits the order of those moves.
Confirmation is not a mathematical guarantee
A second candle in the same direction may satisfy a pattern convention but does not prove that a reversal or continuation will happen. Traders should define the exact criteria and count all occurrences—including failures—over a specified historical sample.
Be careful about timeframe and quote source
A 1-minute candle and a daily candle can offer conflicting-looking patterns because of aggregation. Timezone boundaries, futures contract rollovers and CFD bid/mid/ask choices can also alter candle bodies and wicks. A study based on one feed should not silently be assumed valid on another.
An educational pattern-testing checklist
- Write a formula for the pattern, including body-to-range thresholds and the lookback period.
- Record the price series, instrument, quote side and candle timezone.
- Use completed candles and avoid future knowledge when identifying signals.
- Compare outcomes with a baseline after spreads and financing costs.
- Evaluate the full distribution of results, not a few memorable screenshots.
Key takeaway
Candlesticks are a compact price-history format, not direct evidence of order flow or a standalone forecast. Their possible value depends on repeatable definitions, independent testing and execution costs.
Sources
Continue learning
- Gold Trading for Beginners — Five-Stage Learning Guide
- What Moves Gold Prices? Fundamentals, Yields and the US Dollar
- Common Gold Trading Mistakes and How to Avoid Them
Educational information only. All financial illustrations use hypothetical values unless a historical source and date are specified. Trading gold and leveraged CFDs can result in substantial losses.