
Technical analysis is the study of recorded price behaviour and sometimes trading volume or other market measurements. Charts can help traders summarise a market, mark risk boundaries and express rules precisely. They do not reveal who will trade next or guarantee what XAU/USD will do in the following minute.
Start by identifying the market behind your chart
Gold is traded in OTC dealer markets and on futures exchanges. A retail XAU/USD CFD screen may display the provider’s bid, ask or mid quote rather than transactions on a single central exchange. A COMEX futures chart uses an exchange-traded contract with its own size, expiry and volume. Do not combine quote prices and volume measurements without checking their definitions.
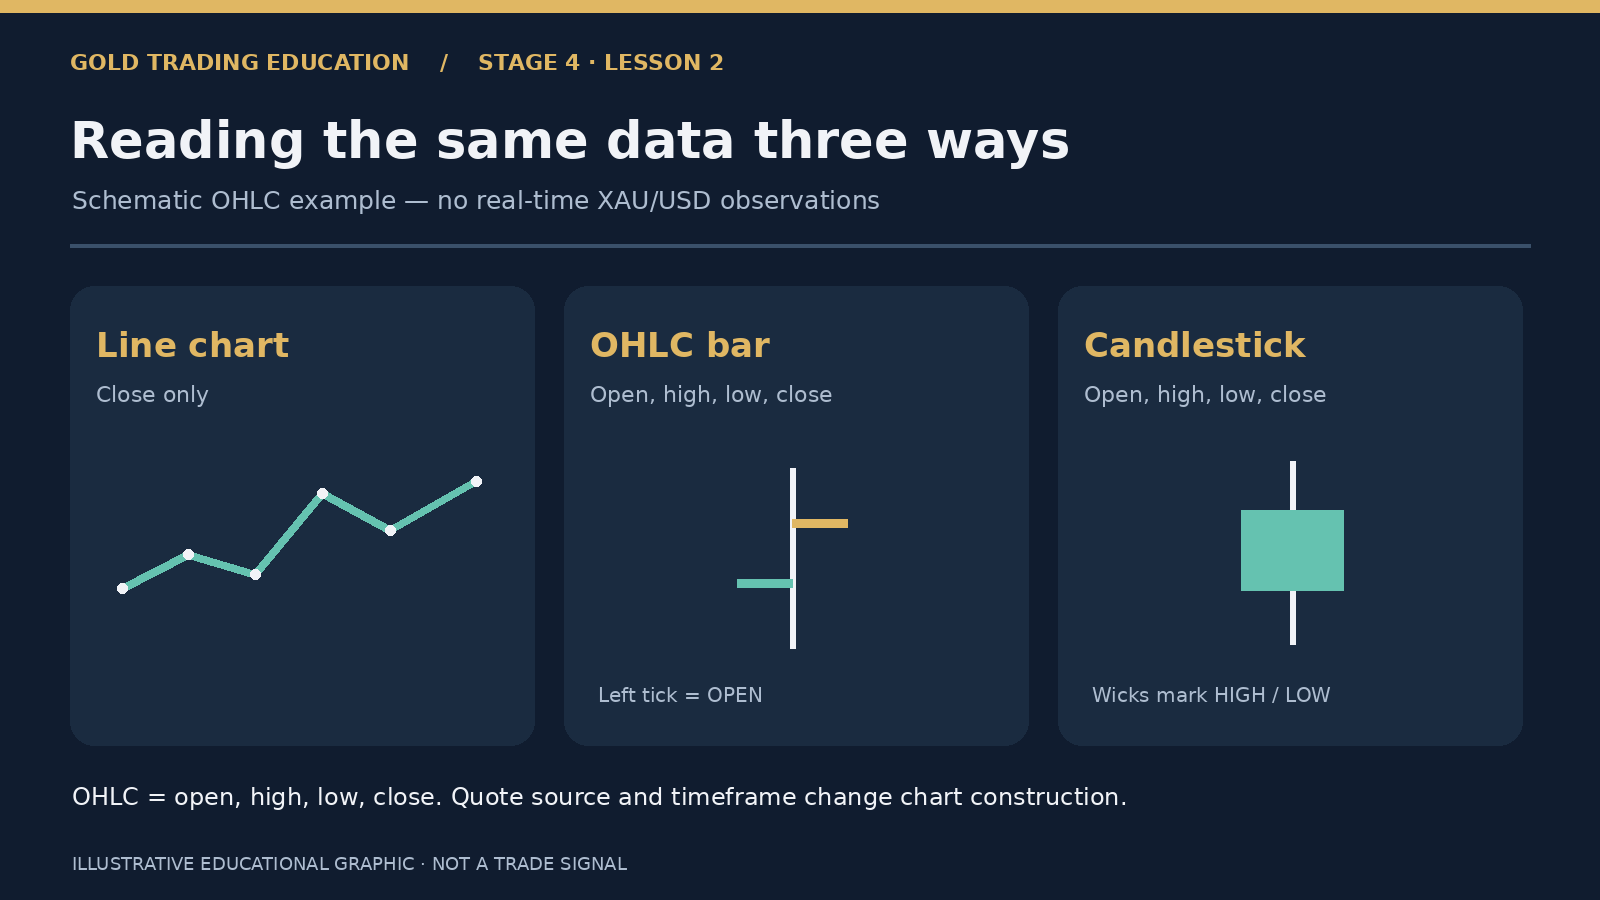
Three ways to display price
| Chart | What it shows | Limitation |
|---|---|---|
| Line chart | Usually one selected value per interval, often the close | Hides the full within-period range |
| OHLC bar | Open, high, low and close for each interval | Still omits the exact order of the intrabar moves |
| Candlestick | The same OHLC values, using body and wicks | Colour is a visual convention, not buyer identity |
The CME Group’s technical-analysis guide introduces these basic chart formats. Changing the chart timeframe changes how observations are grouped; two providers may show slightly different candle extremes if their quote sources or session boundaries differ.
How to read a gold candle
The open is the first recorded price for the interval; high and low are the observed extremes; the close is the final recorded price. A rising candle normally has a close above its open. Wicks mark the distance from the body to the observed extremes. None of these values identifies the motives or trades of an individual institution.
Trends and ranges are definitions, not predictions
A trend label might refer to a sequence of higher swing highs and lows, or a moving-average slope. A range might describe a price series fluctuating within recently observed boundaries. Both depend on chosen definitions and timeframe. What looks like a breakout on a 1-minute chart can be insignificant on a daily chart.
Patterns often fail
- Support and resistance: recently observed levels where prices turned or stalled, not guaranteed future barriers.
- Head and shoulders: a named shape whose identification and trading rules can be subjective.
- Double top or bottom: similar extreme observations that may precede reversals, continuations or no clear move.
- Breakout: a rule-based move beyond a level, which may reverse quickly or fail to fill at the observed price.
An example of a testable chart rule
Instead of saying ‘buy a strong gold breakout’, a researcher could define: on a specified instrument and timeframe, record every instance where a completed candle closes above the previous 20-candle high, and measure subsequent returns after costs. This is a hypothesis for evaluation, not a recommended strategy. Specify how ties, gaps, quotes, rollover and spread are handled.
Chart volume needs special care
Exchange futures volume counts contracts traded on that venue. Some spot/CFD platforms provide tick volume, which can count quote changes or activity within one provider’s feed; it is not necessarily aggregate world gold volume. A volume spike on one broker’s chart is not proof of worldwide institutional order flow.
What makes chart analysis more trustworthy?
- Record the data vendor, instrument, timezone and bid/ask setting.
- Define indicators and patterns before reviewing outcomes.
- Avoid seeing tomorrow’s price when deciding what today’s entry rule would do.
- Test across multiple periods, trading sessions and market regimes.
- Include realistic spreads, commissions, financing and unsuccessful fills.
- Describe a failure condition and consider staying flat.
Key takeaway
Gold technical analysis helps organise observed data. A chart pattern becomes useful only if its decision rule and out-of-sample evidence hold up after costs and execution uncertainty.
Sources
Continue learning
- Gold Trading for Beginners — Five-Stage Learning Guide
- How to Choose a Gold CFD Broker
- What Moves Gold Prices? Fundamentals, Yields and the US Dollar
Educational information only. All financial illustrations use hypothetical values unless a historical source and date are specified. Trading gold and leveraged CFDs can result in substantial losses.