

How to recognise trends, pullbacks and possible reversals on an XAU/USD chart
A beginner-friendly illustrated guide | Estimated reading time: 18–22 minutes
The chart can be confusing. The explanation doesn’t have to be.
Imagine opening a five-minute gold chart and seeing price fall. One trader says gold has turned bearish. Another says the uptrend is still intact. Both are looking at the same candles. How can they disagree?
Usually, they are looking at different-sized price movements. The first trader is describing a small, recent decline. The second is comparing that decline with a much larger move. Neither description is necessarily wrong. The key is knowing which movement you are talking about.
That is the purpose of market structure. It is a simple way to organise the movement of price into highs, lows, trends, ranges and potential turning points. It will not predict gold’s next move. It can, however, make your chart easier to read and help you notice when your original interpretation needs to change.
By the end of this guide, you should be able to answer five questions: Is gold broadly rising, falling or moving sideways? Which highs and lows actually matter? Did price break an important level, or merely move past it briefly? Is an apparent reversal actually a pullback? And what evidence would make you change your view?
Key takeaways
- Price tends to move in swings: an advance, a pullback and another advance—or the reverse.
- A larger uptrend can contain several smaller declines without ending.
- A break of an important high or low is a clue, not a guaranteed trade signal.
- Always identify your chart’s timeframe and reference levels before declaring a reversal.
- If the structure is unclear, staying out of a trade is a reasonable decision.
Jump to a section
1. First, recognise the three market conditions
Before drawing lines or learning abbreviations, ask one question: What is the overall direction of the price swings?
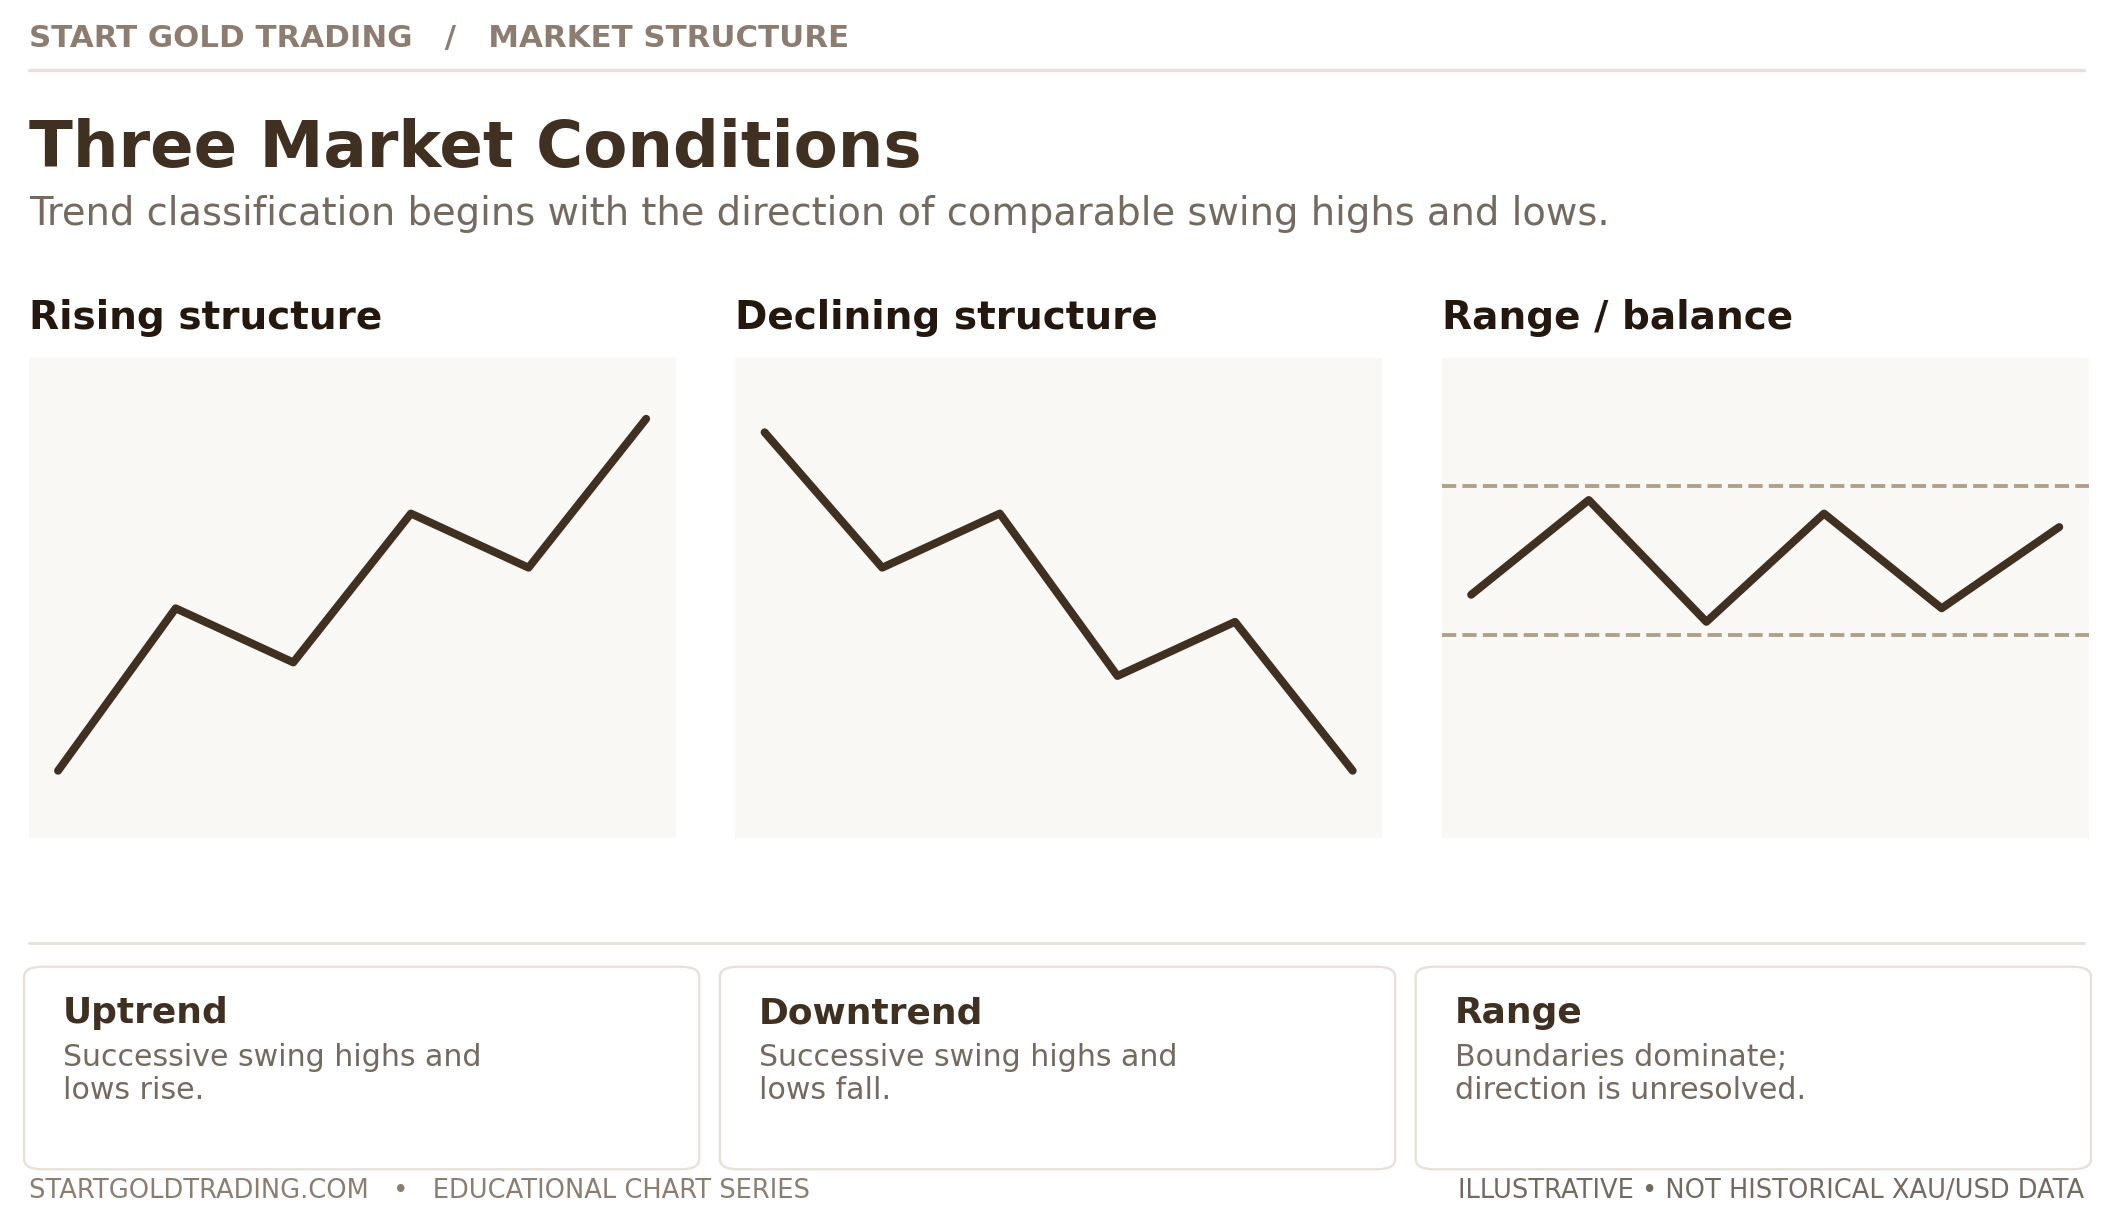
An uptrend generally forms a series of rising peaks and rising pullback lows. Think of someone climbing stairs. They move upward, stop, take a step down, then climb higher. The small step down does not erase the larger climb.
A downtrend is the opposite: lower peaks and lower lows. Temporary rallies may occur, but they do not necessarily reverse the downward movement.
A range occurs when price keeps returning to broadly similar highs and lows without a clear directional advance. Imagine a ball bouncing between a floor and a ceiling. The boundaries may be zones rather than perfect horizontal lines, and they can eventually break.
These are descriptions, not predictions. Calling gold bullish means you have identified a rising structure under your chosen rules. It does not mean the next candle must rise.
Try this: Open a gold chart, zoom out and hide non-essential indicators. Without placing a trade, decide whether the most visible movements are generally ascending, descending or contained in a range. If you cannot decide, note that the structure is mixed. Uncertainty is useful information.
2. Read the highs and lows that matter
Each time price rises and then turns lower, it may create a swing high. Each time it falls and then turns higher, it may create a swing low. These turning points are the building blocks of market structure.
Four short labels make conversations about trends much easier:
- HH — Higher high: a peak above the previous relevant peak.
- HL — Higher low: a pullback low above the previous relevant low.
- LH — Lower high: a rebound peak below the previous relevant peak.
- LL — Lower low: a trough below the previous relevant trough.
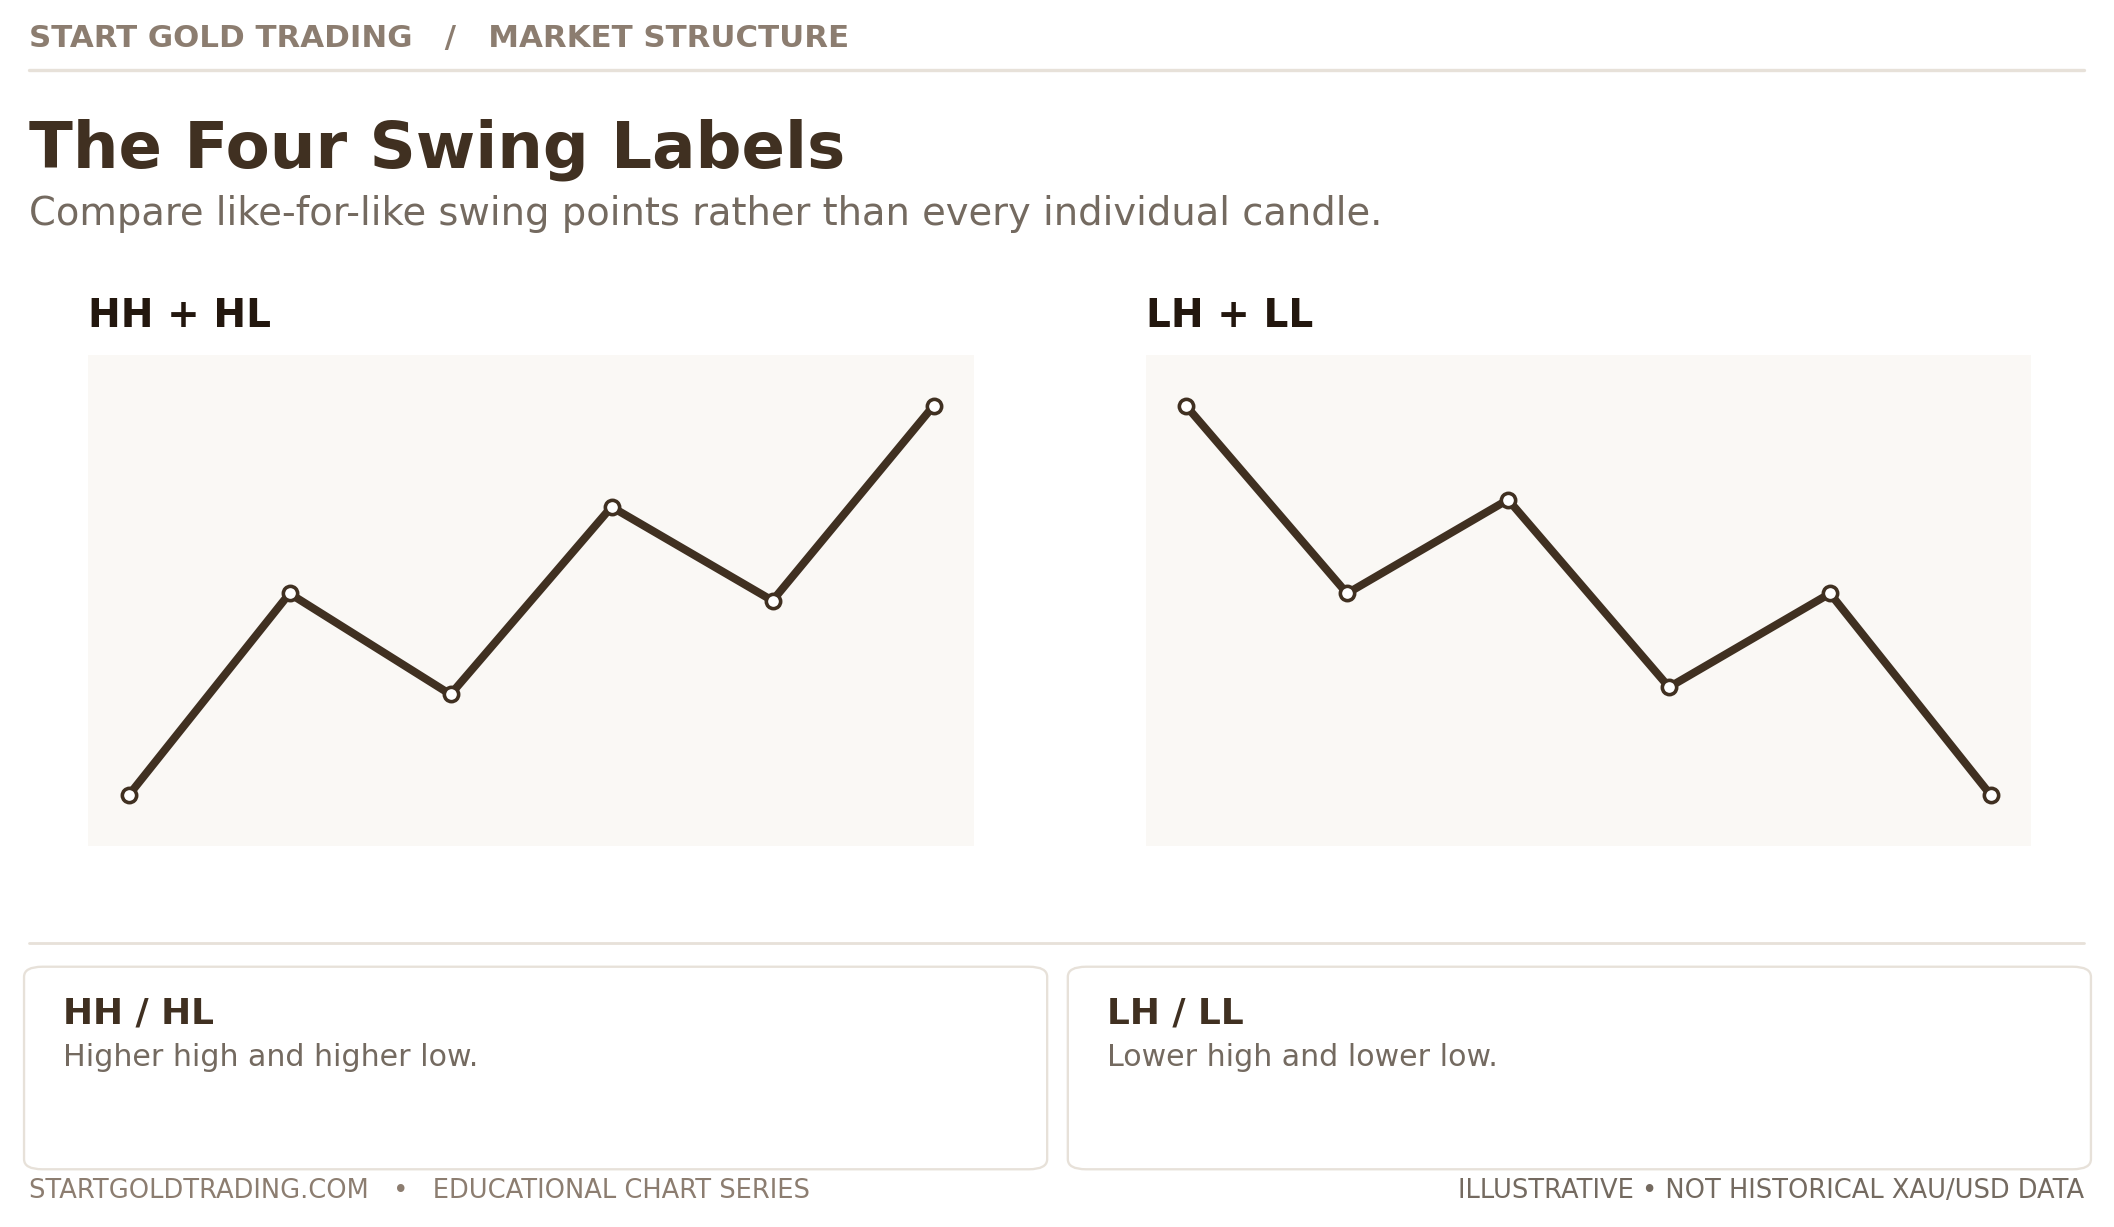
For example, suppose an illustrative gold chart moves from 3,900 to 3,950, retreats to 3,925 and then rises to 3,980. The second peak is higher than the first, while the pullback low remains above 3,900. That is a straightforward example of an upward swing structure. The prices are hypothetical, not a report of a real trading session.
If individual candles are unfamiliar, our gold candlestick patterns guide explains candle bodies, wicks and their limitations.
The complication is that not every tiny wiggle is equally important. On a five-minute chart, gold may make many local highs and lows during a single one-hour pullback. If you label every one as a major trend change, the chart quickly becomes unreadable.
To make the labels consistent, choose a rule for what counts as a swing point. One common teaching rule requires a candidate high to be higher than the highs of two candles before it and two candles after it. That leads to an important limitation: the high cannot be confirmed until the following two candles exist. You cannot use knowledge of future candles in a real-time decision.
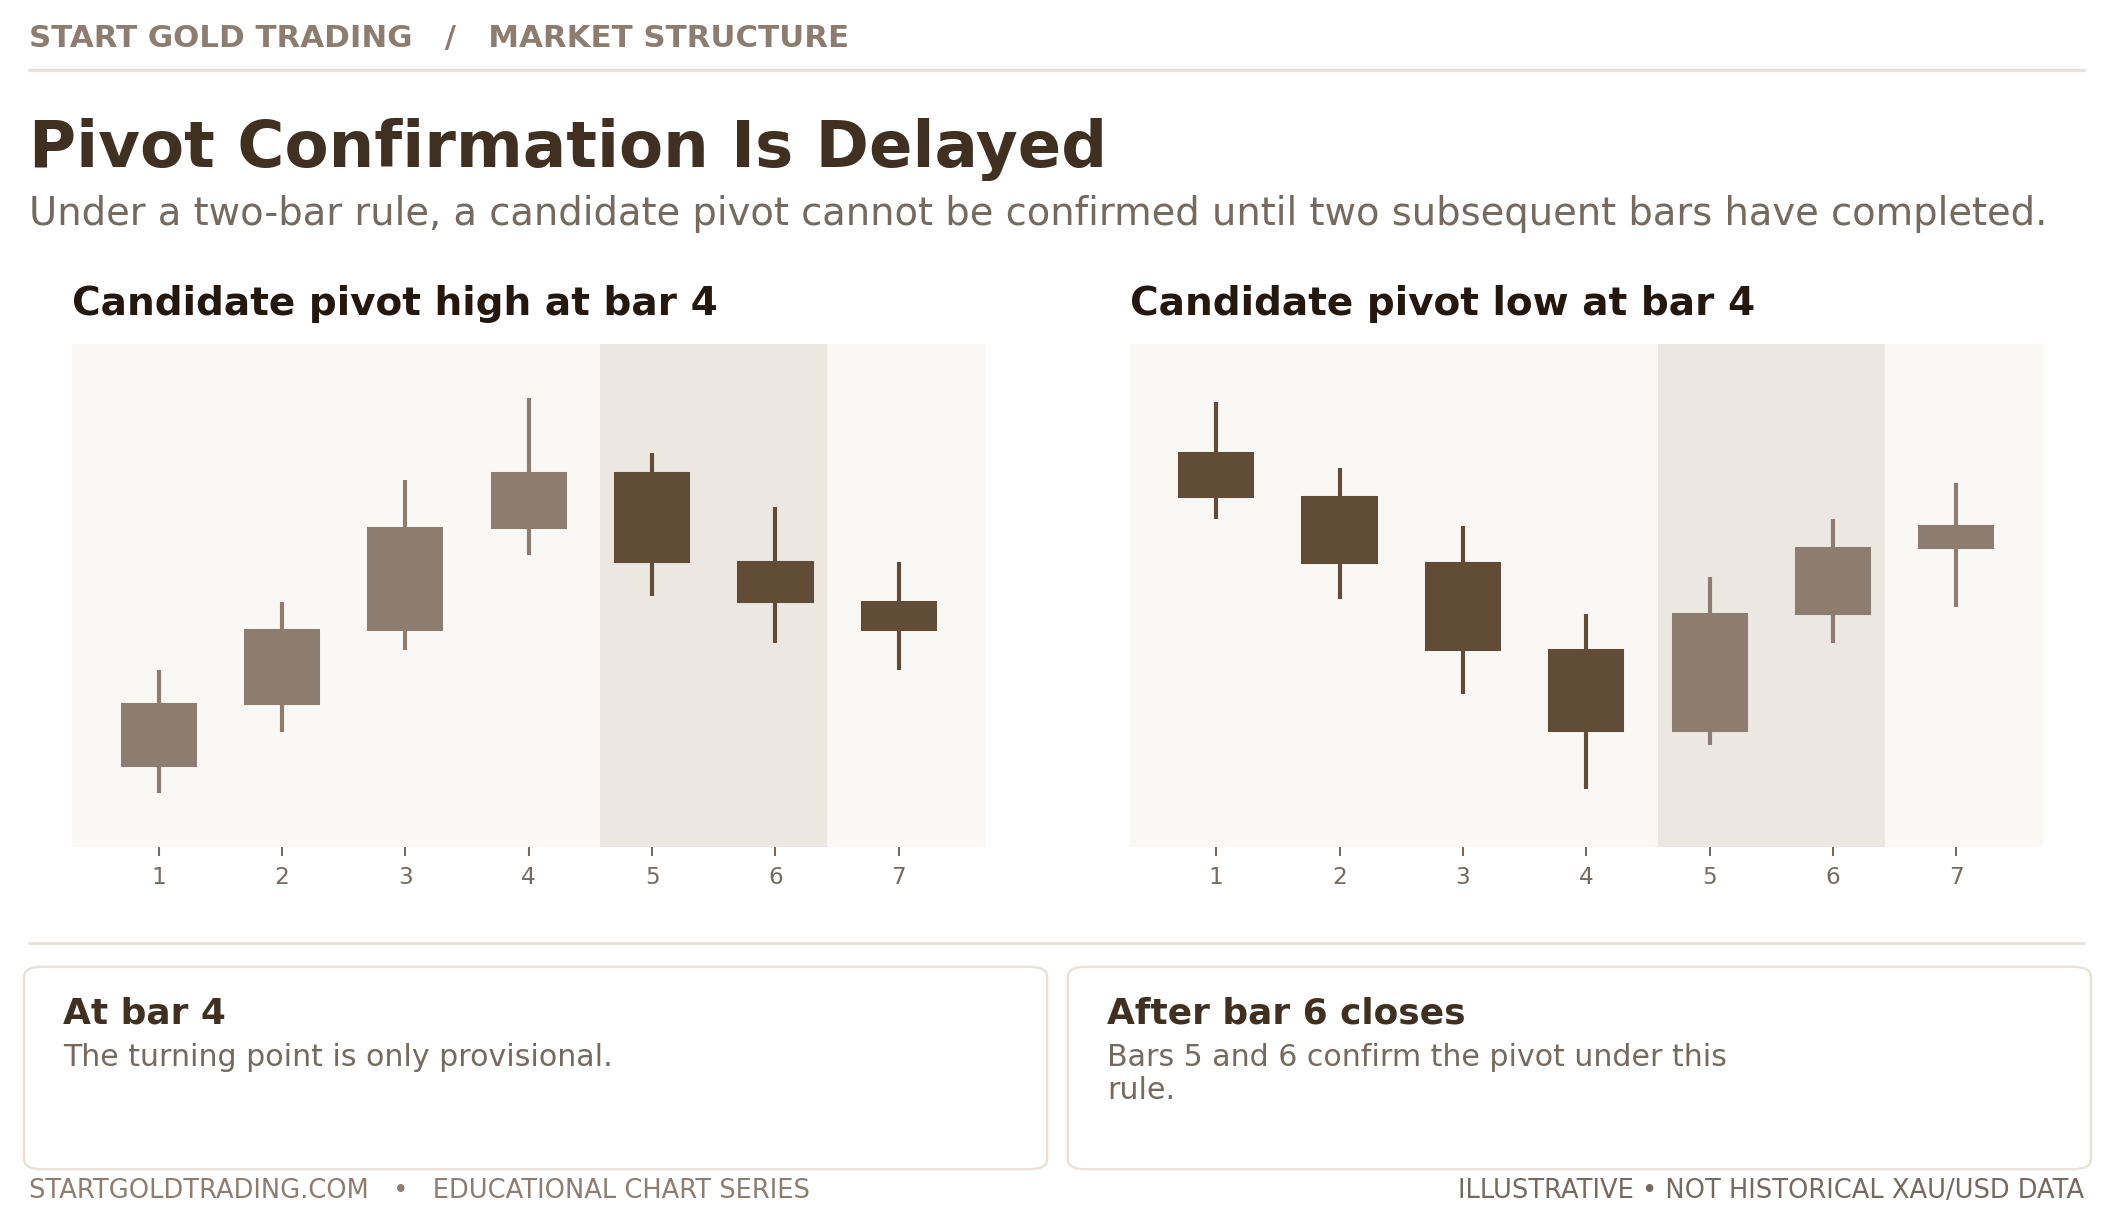
You do not have to use that specific two-candle method. The practical lesson is to be consistent. Pick a way of marking meaningful swings, identify when each swing was actually confirmed, and avoid changing the rules after you have seen what happened next.
Remember: A swing point can be obvious in hindsight but uncertain when price is still moving. A beginner does not need to label everything.
3. Understand breaks, without treating them as magic signals
Once you can identify a significant high and low, it becomes easier to recognise when price moves beyond one of them.
In many trading communities, a break beyond a relevant swing level is called a break of structure, or BOS. The term is often used for continuation in the prevailing direction. For example, if gold forms higher highs and higher lows, then closes above a previously confirmed high, some traders label that event a bullish BOS.
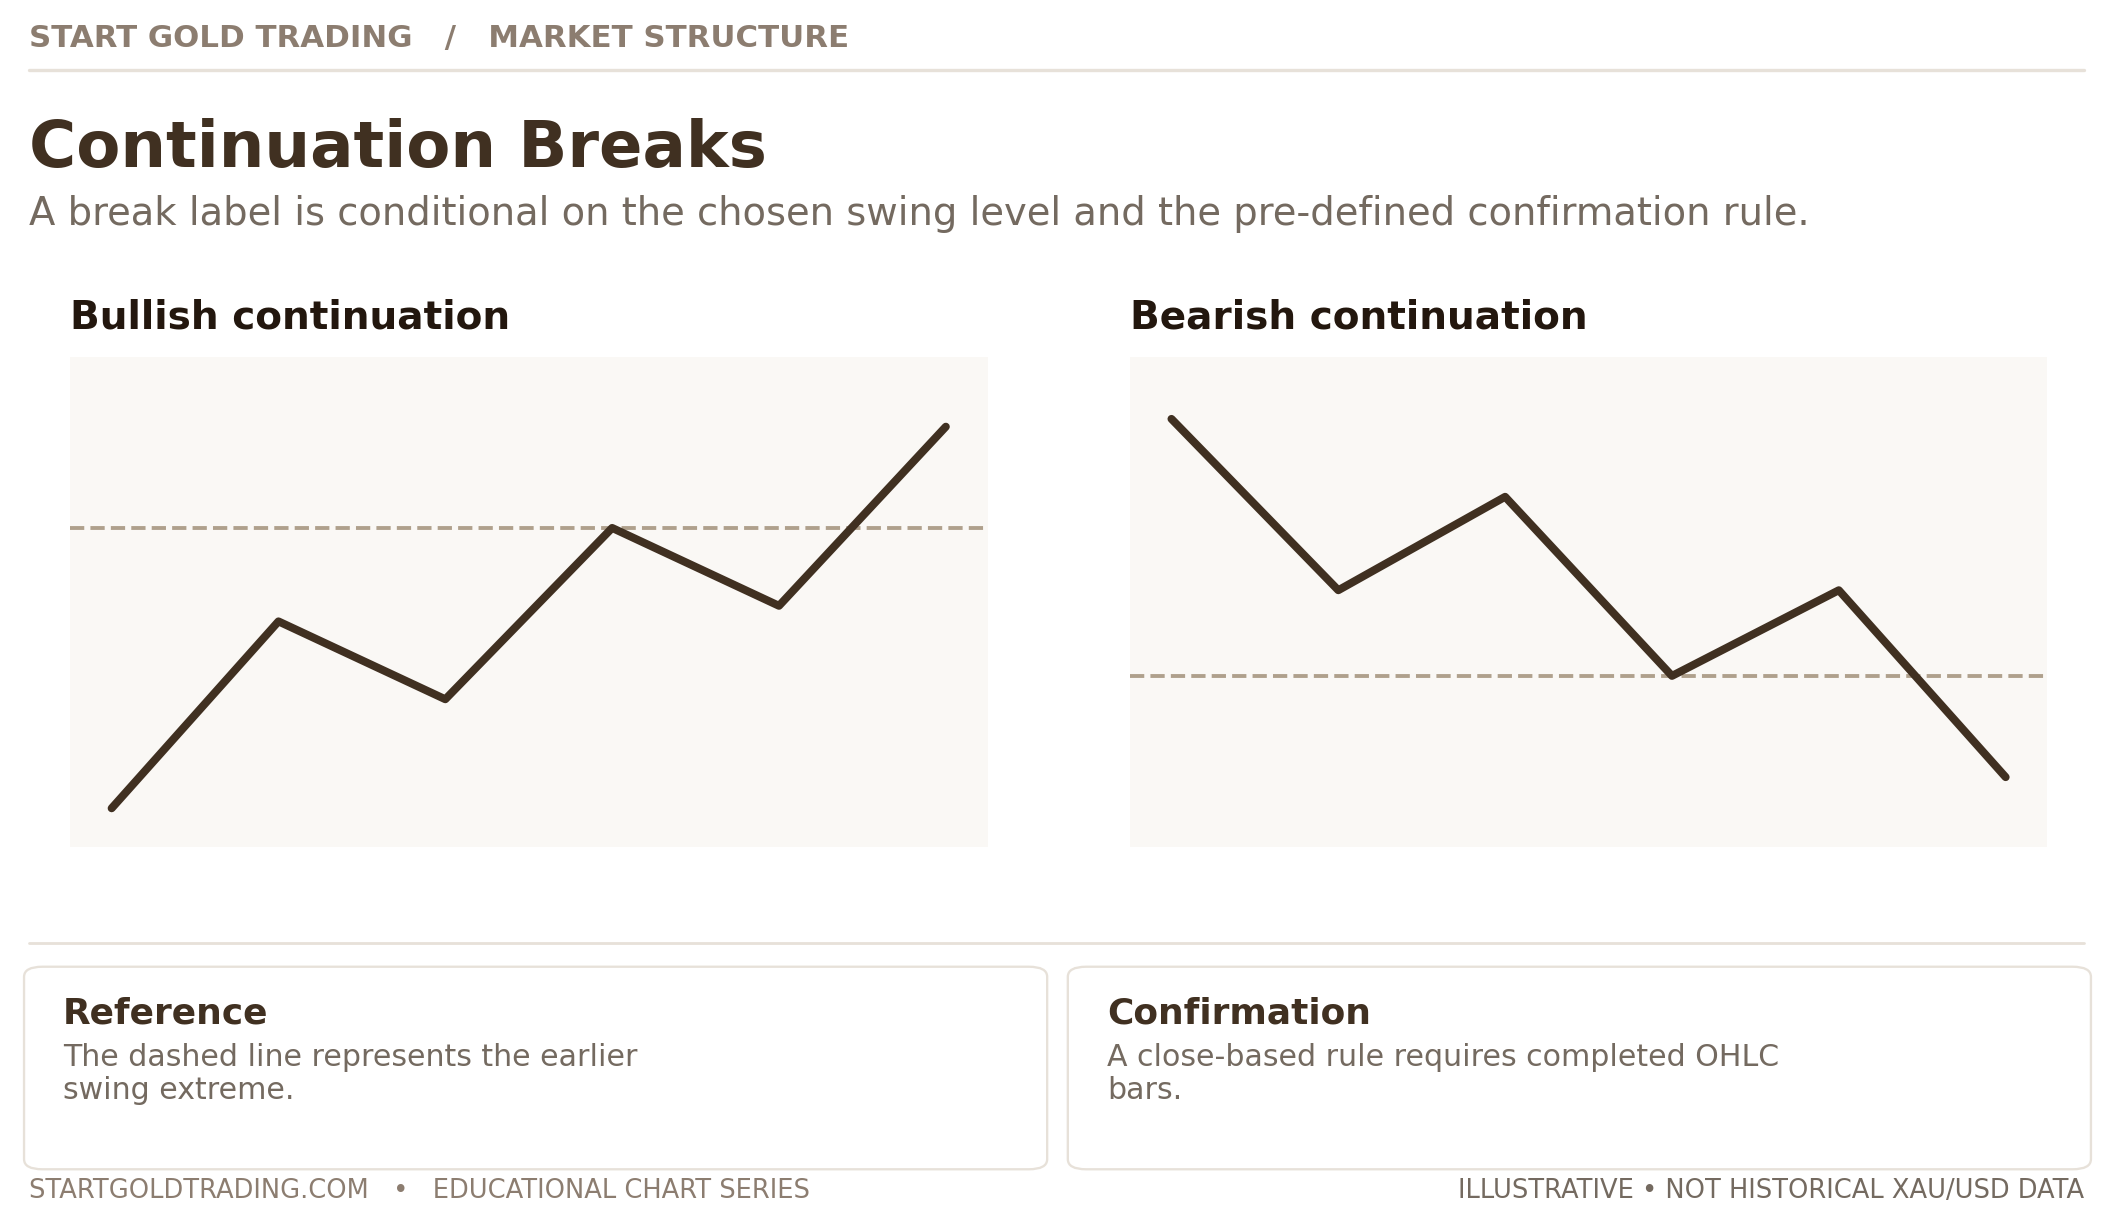
But two questions matter more than the abbreviation: Which level was broken? And what did you require to count it as a break?
Consider gold approaching resistance near a hypothetical 4,000. One candle briefly trades at 4,005 but finishes at 3,992. Another candle later closes at 4,012. Both traded above 4,000, but only the second closed above it. Analysts who require a candle close will treat these two events differently.
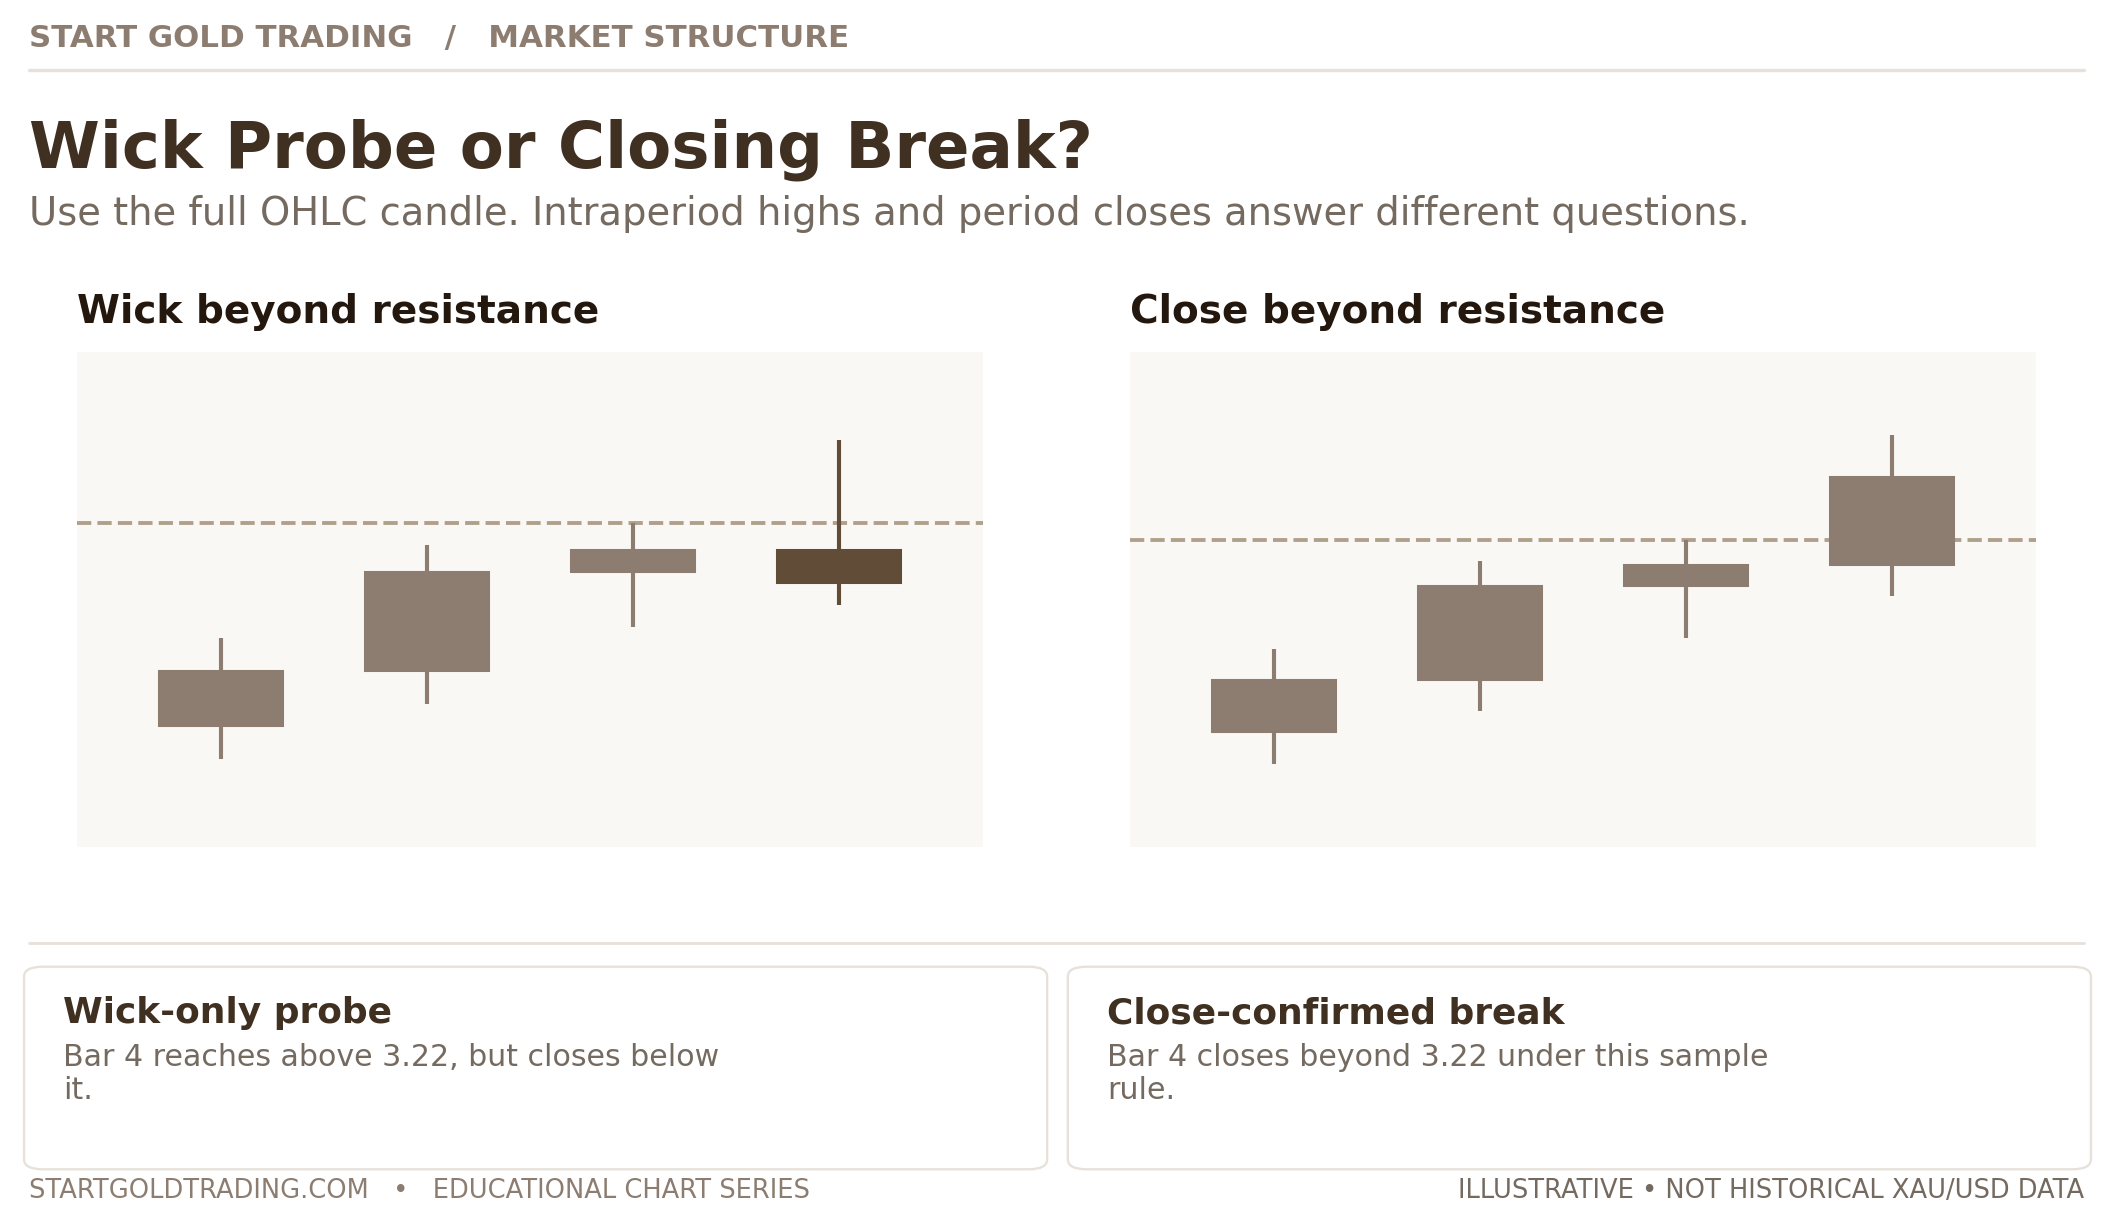
Even a convincing close can fail. Price may return below the old level a few candles later. That is why it is useful to distinguish a breakout attempt from a sustained break. Neither one guarantees that a new trend has begun.
A break against the previous trend is sometimes called a change of character, or CHoCH. The term is not perfectly standardised. Some traders use it for the first small break against the trend, while others reserve it for a more important structural boundary. We will use the ordinary-language term possible reversal when the abbreviation would make the discussion less clear.
Simple rule: When someone says “BOS” or “CHoCH,” ask them to point to the exact high or low being used. If the reference level is unclear, the label is not very helpful.
Evidence limitation: These labels are not standardised performance measures. This article explains how some traders describe chart behaviour; it does not demonstrate that trading BOS or CHoCH patterns produces a reliable profit after spreads, commissions or slippage. That would require separately defined rules and appropriately tested historical results, including losing examples.
4. The most important lesson: a pullback is not always a reversal
This is the heart of the guide—and a common reason new gold traders misread charts.
Imagine that gold has climbed steadily over several hours. On a five-minute chart, the price then starts falling. Its smaller rallies make lower highs, and its smaller declines make lower lows. The short-term picture looks bearish.
Does that mean the larger uptrend is over? Not necessarily. The five-minute decline may be only one part of a correction within a larger one-hour or four-hour advance.
A correction can be much messier than a single downward line. It may contain several smaller rallies, declines and temporary breaks. Traders sometimes call this a complex or nested retracement. The everyday meaning is simpler: the market is taking a complicated route backward before we know what happens next.
Follow the four illustrations below. They use one continuing, hypothetical movement—not historical XAU/USD prices.
Step 1 — Identify the larger upward move
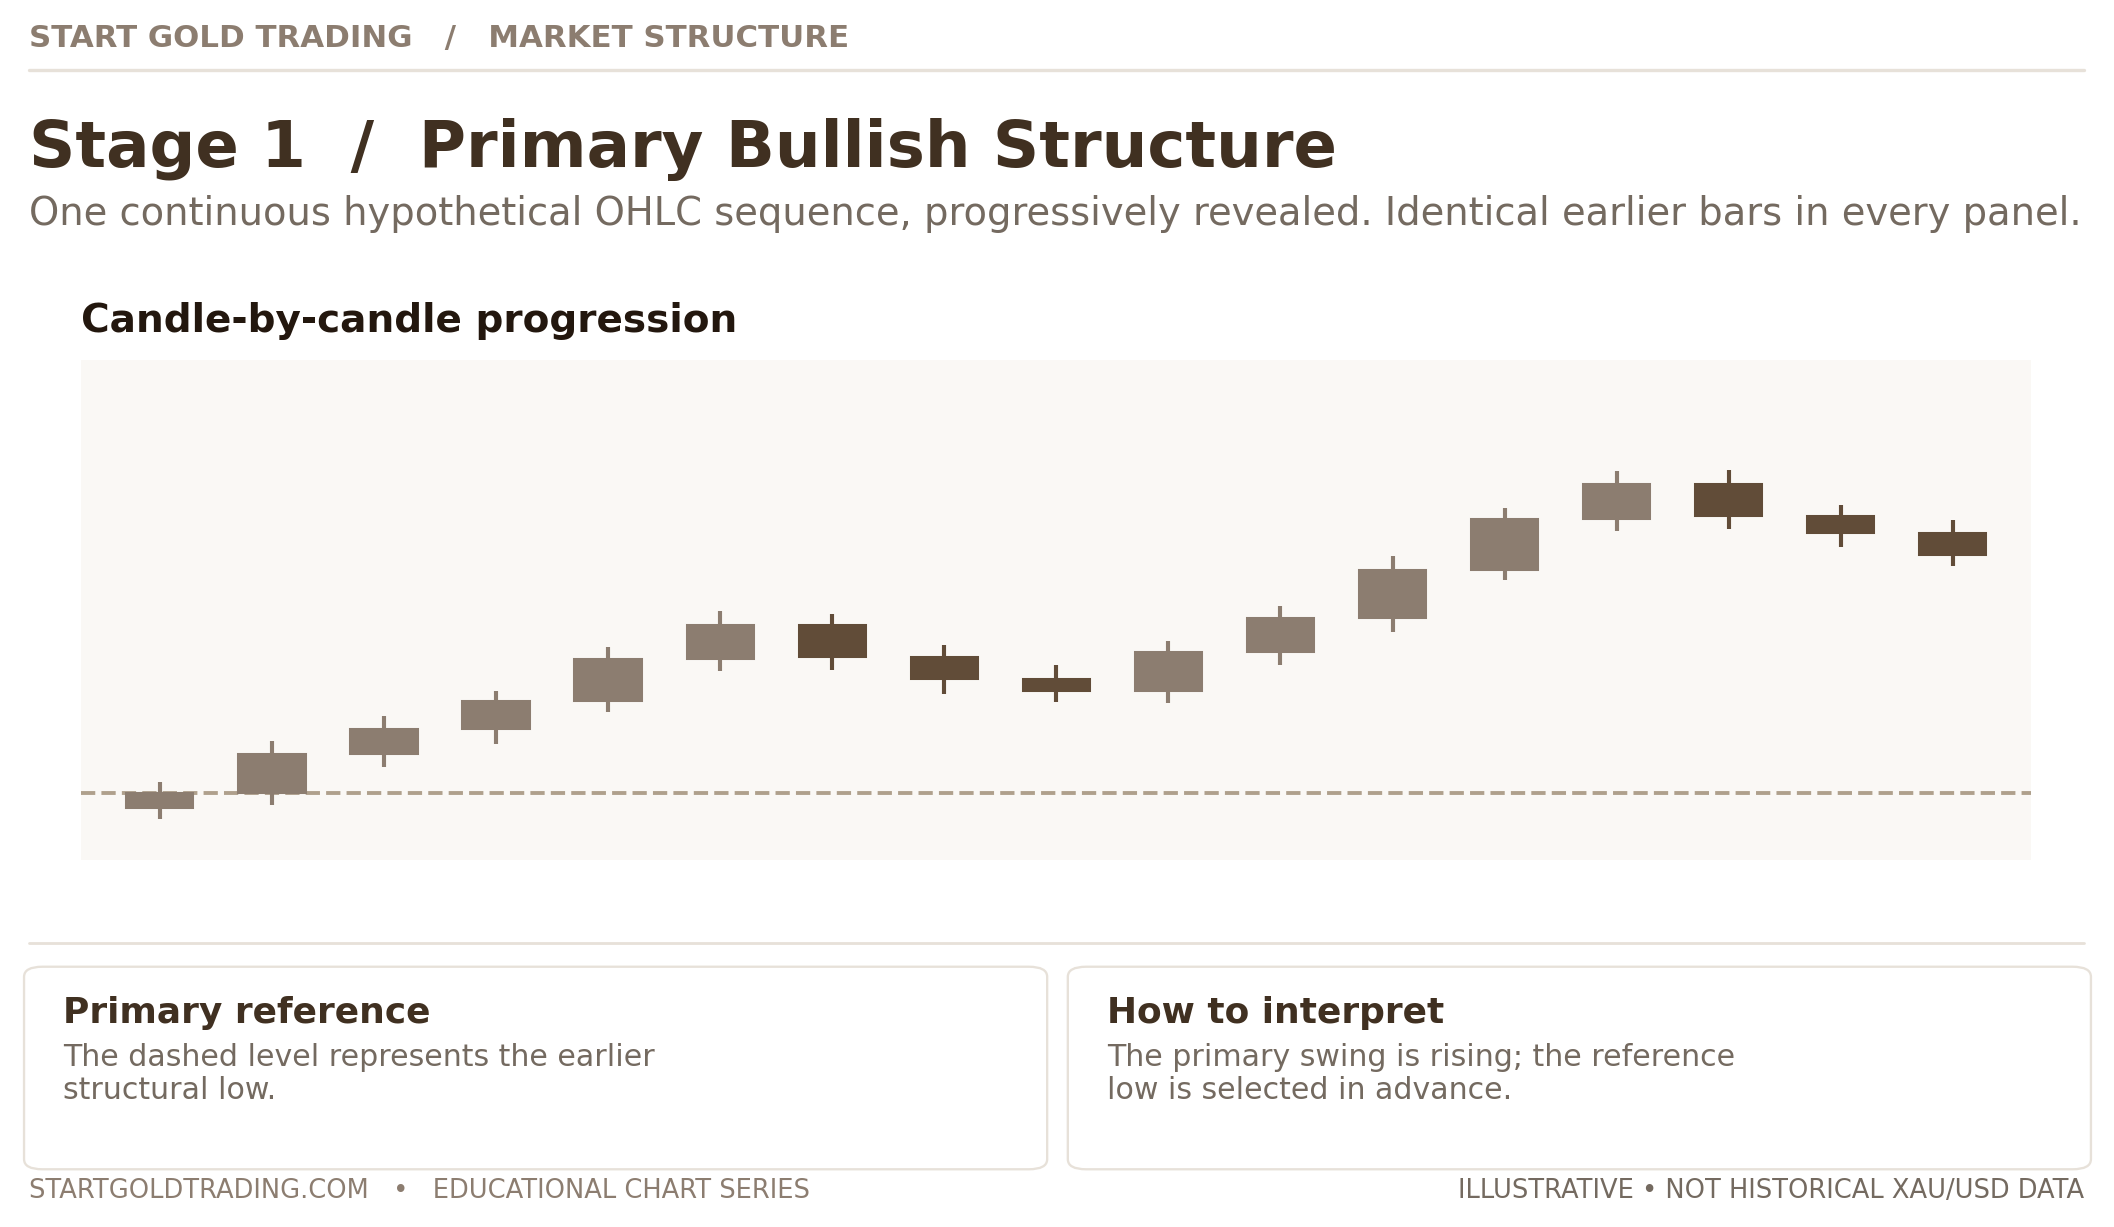
The chart has been advancing. There is an earlier important low and a more recent high. Before interpreting the next few candles, mark the low that matters to this larger swing. This is your reference point, not a promise that price will hold above it.
Step 2 — A smaller decline begins
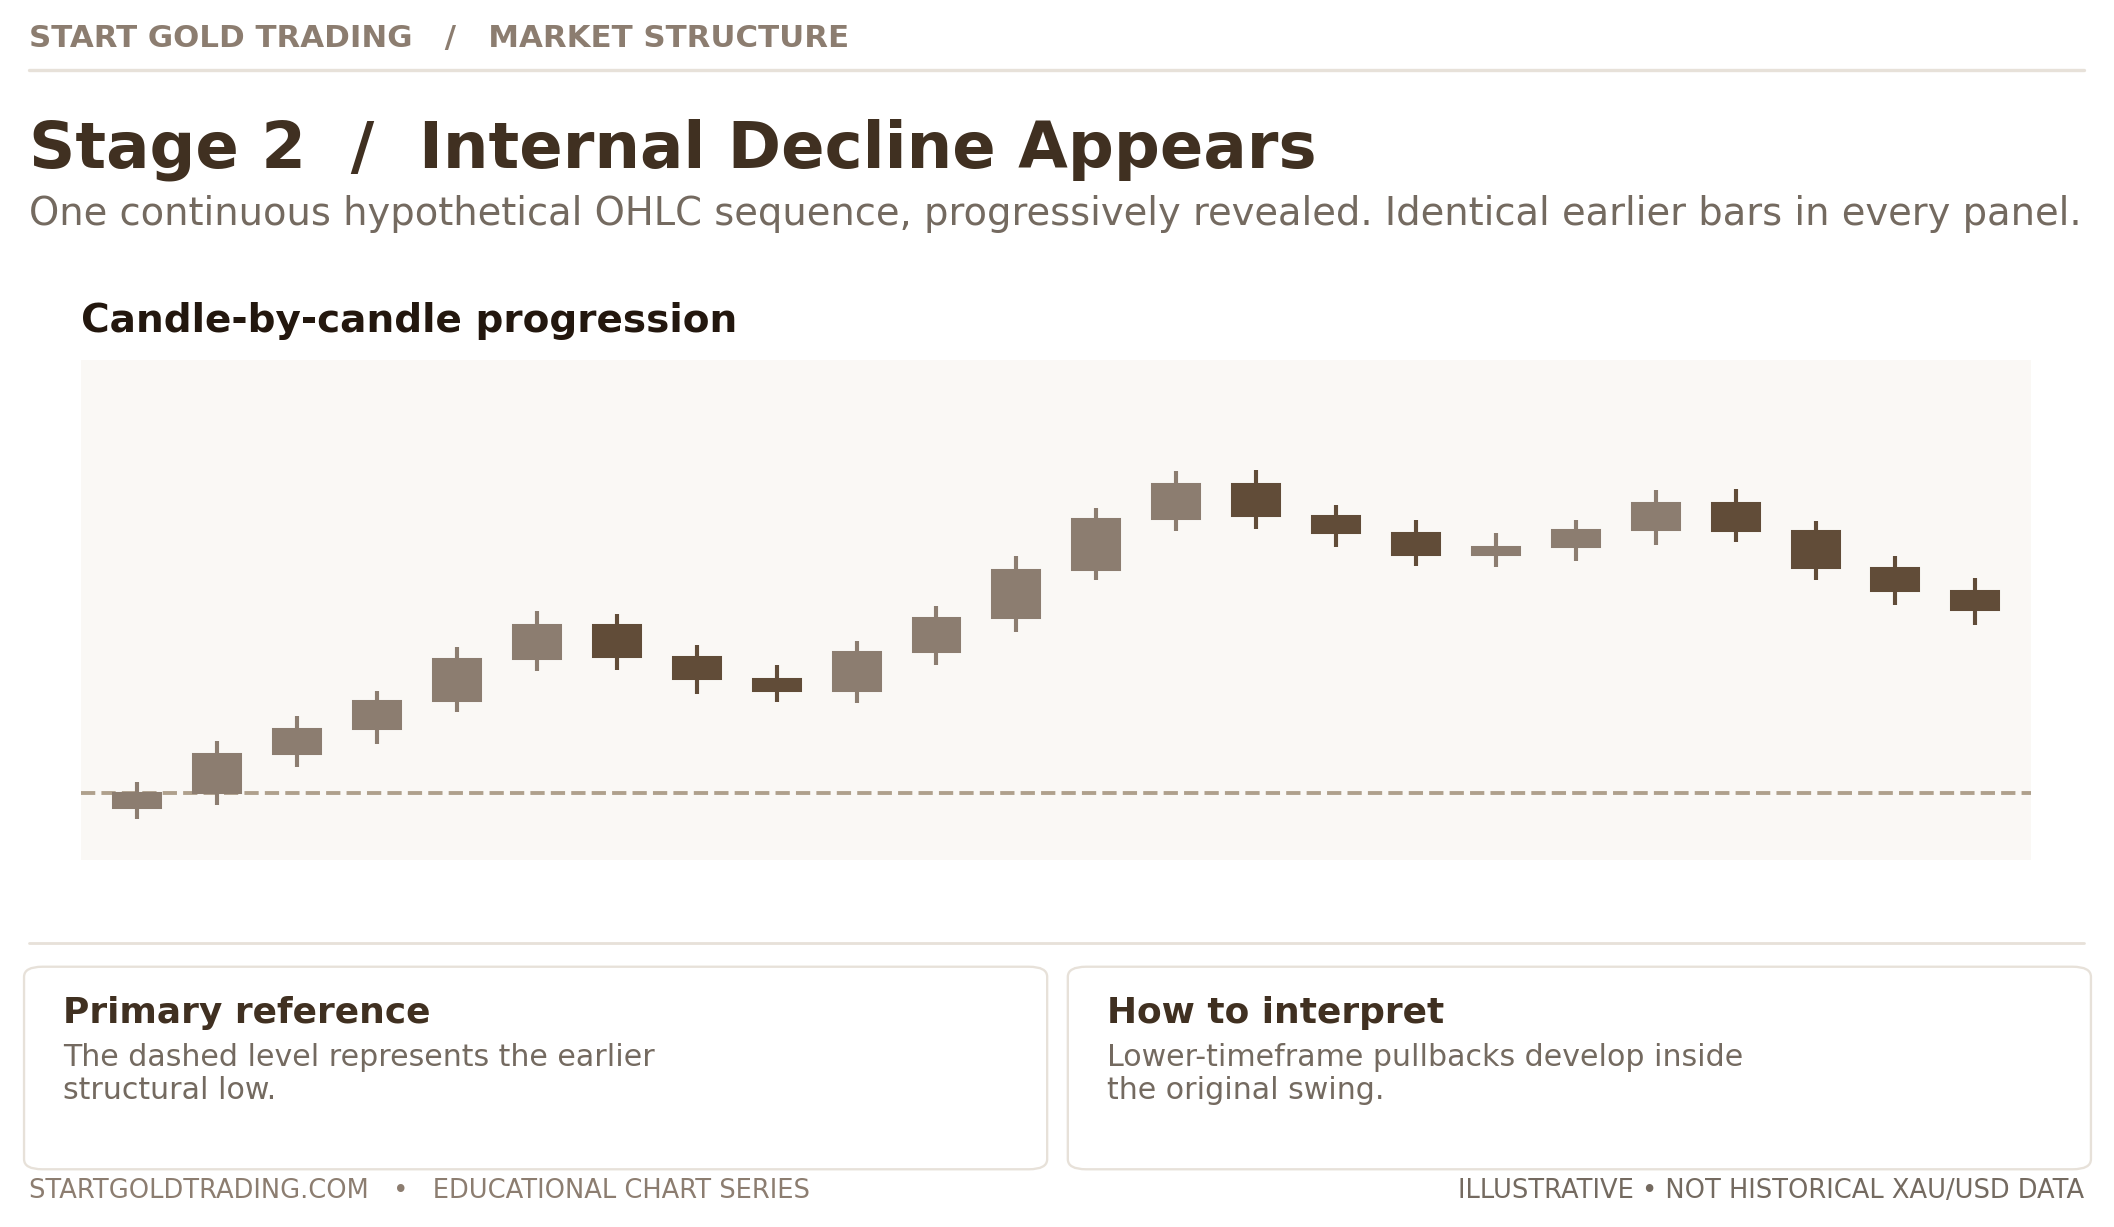
The chart starts to make lower highs and lower lows on the smaller scale. A short-term bearish interpretation may be reasonable. But notice that the larger reference low has not yet been broken. The statements “the small swing is falling” and “the larger bullish structure has not yet been invalidated” can both be true.
Step 3 — The pullback becomes deeper
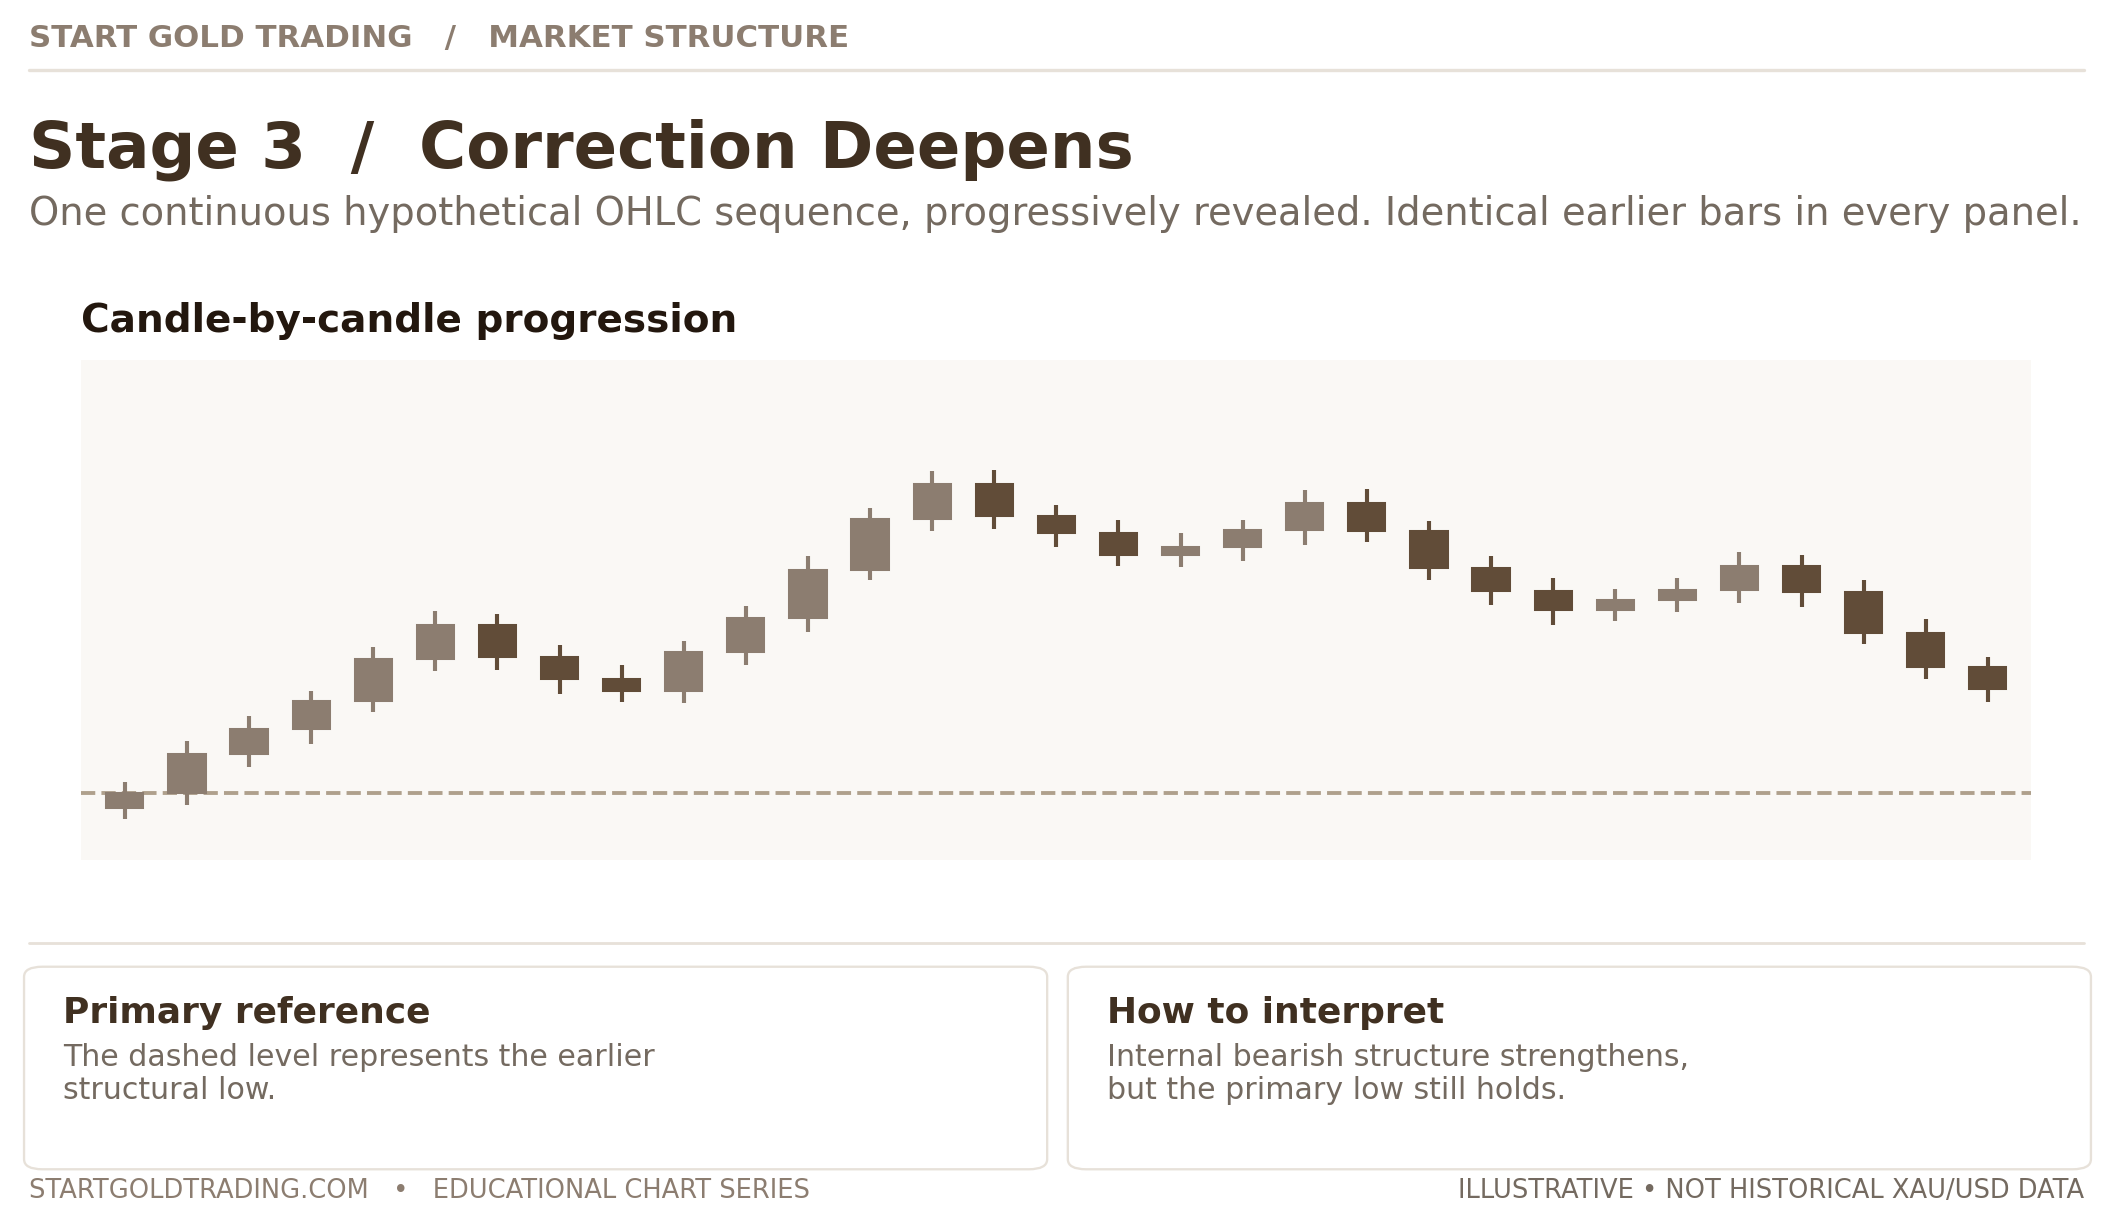
Price moves down again. This is where beginners often become confident that a full reversal has occurred. Yet under our chosen larger-swing rule, the important low still holds. We cannot know whether gold will bounce, range or continue falling. What we can say is which boundary would challenge our larger bullish reading.
Step 4 — The larger uptrend resumes
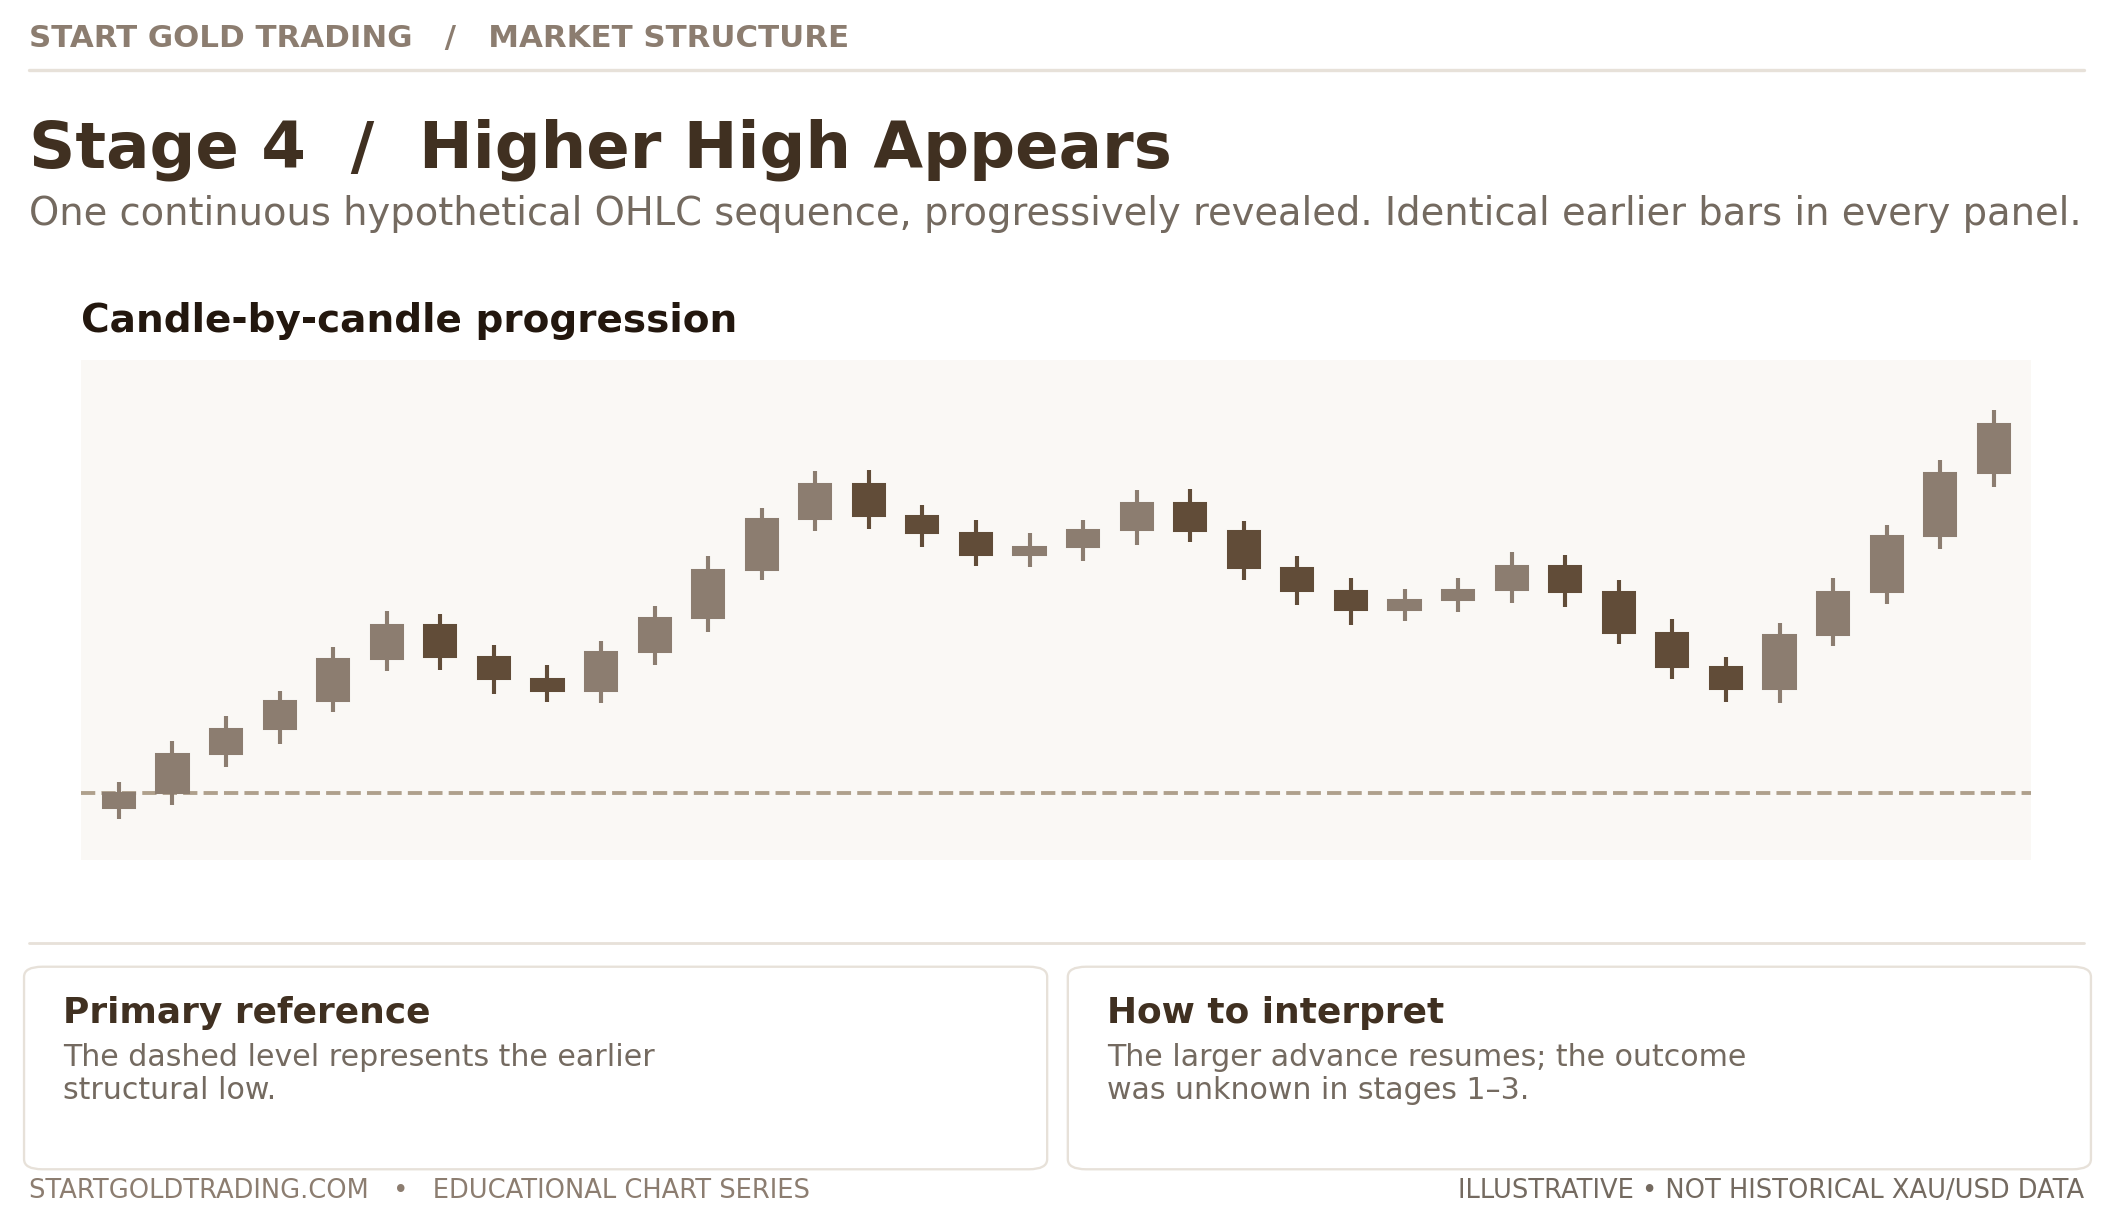
In this constructed example, price turns upward and reaches a new high. Looking back, the smaller decline was a correction rather than the start of a lasting downtrend. This ending is revealed only to teach the distinction. It does not mean real corrections will always recover or that their turning points can be predicted in advance.
The takeaway is not “always buy the dip.” It is: do not promote a small, local reversal into a major trend reversal without checking the larger structure. The opposite is also true. If price breaks the chosen larger swing low under your stated rules, you must be willing to reconsider the bullish interpretation.
5. Why the timeframe changes the answer
A chart’s timeframe describes how much time each candle covers. On M5, every candle covers five minutes. On H1, every candle covers one hour. On H4, every candle covers four hours. A daily candle summarises a trading day according to that data provider’s clock.
The shorter the timeframe, the more local price movement you see. The longer the timeframe, the more that movement is compressed into broader swings.
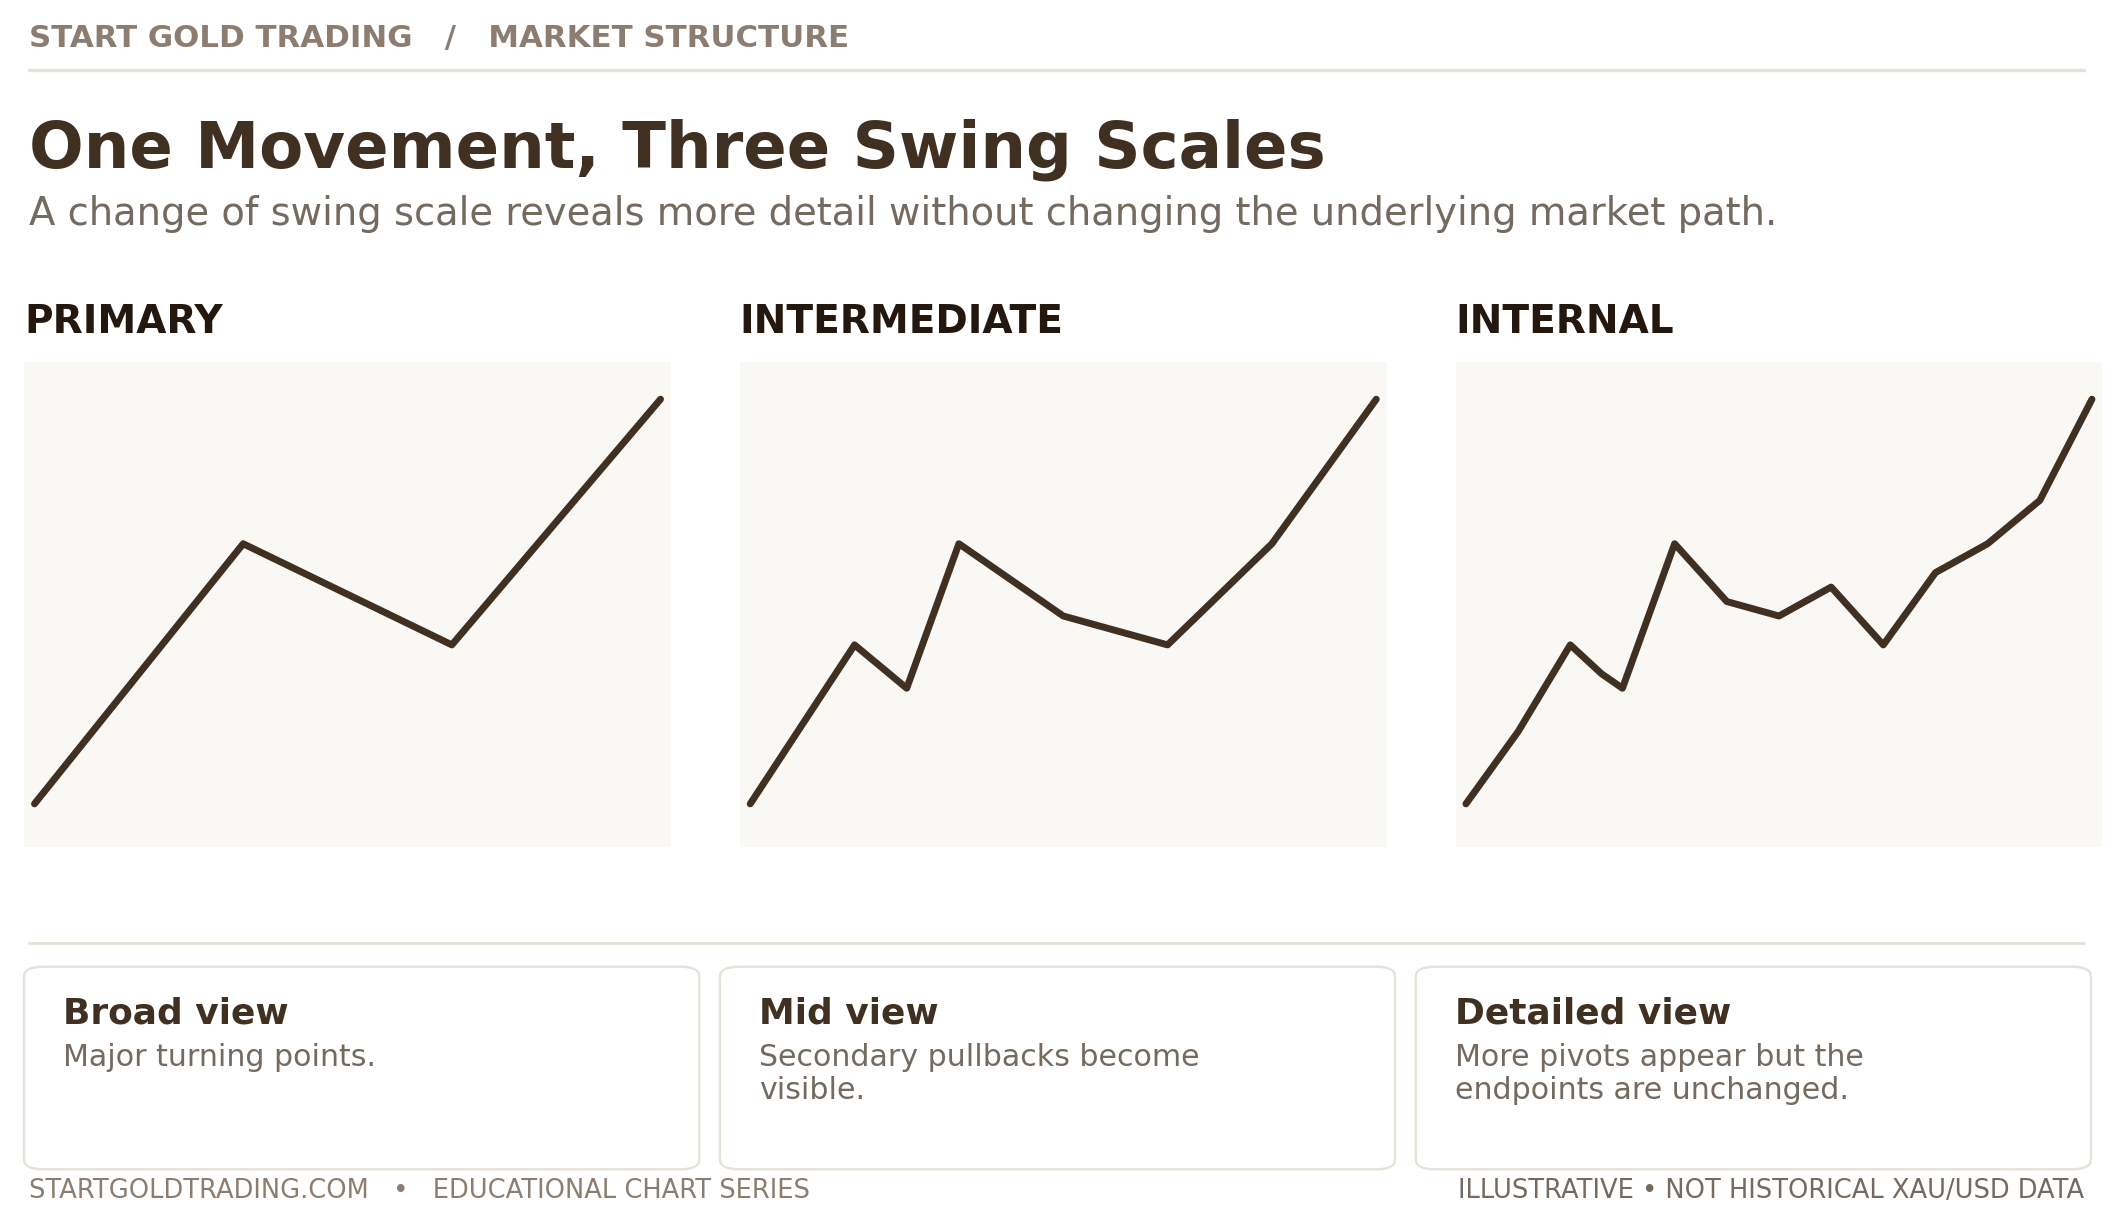
Here is an approachable way to use more than one timeframe without getting lost:
First, look at the larger picture. For example, open H4 and describe the recent major swing. Is it rising, falling or ranging? Mark one or two meaningful boundaries.
Next, look at the middle picture. On H1, ask whether the latest movement appears to be continuing that larger swing or moving against it. Do not redraw every small wick.
Finally, look closer only if needed. On M15 or M5, examine the smaller swings. If they contradict the larger chart, write down the difference rather than assuming one chart must be wrong.
This is known as top-down analysis. It is not a guarantee of better trading performance. It is simply a way to keep the smaller chart in context.
Gold charts from different brokers can also vary slightly because of their feed, spread and candle cut-off times. A structural level on one data source is not necessarily identical to the level on another. For learning, keep the same source and timeframe when comparing examples.
6. A simple gold-chart reading routine
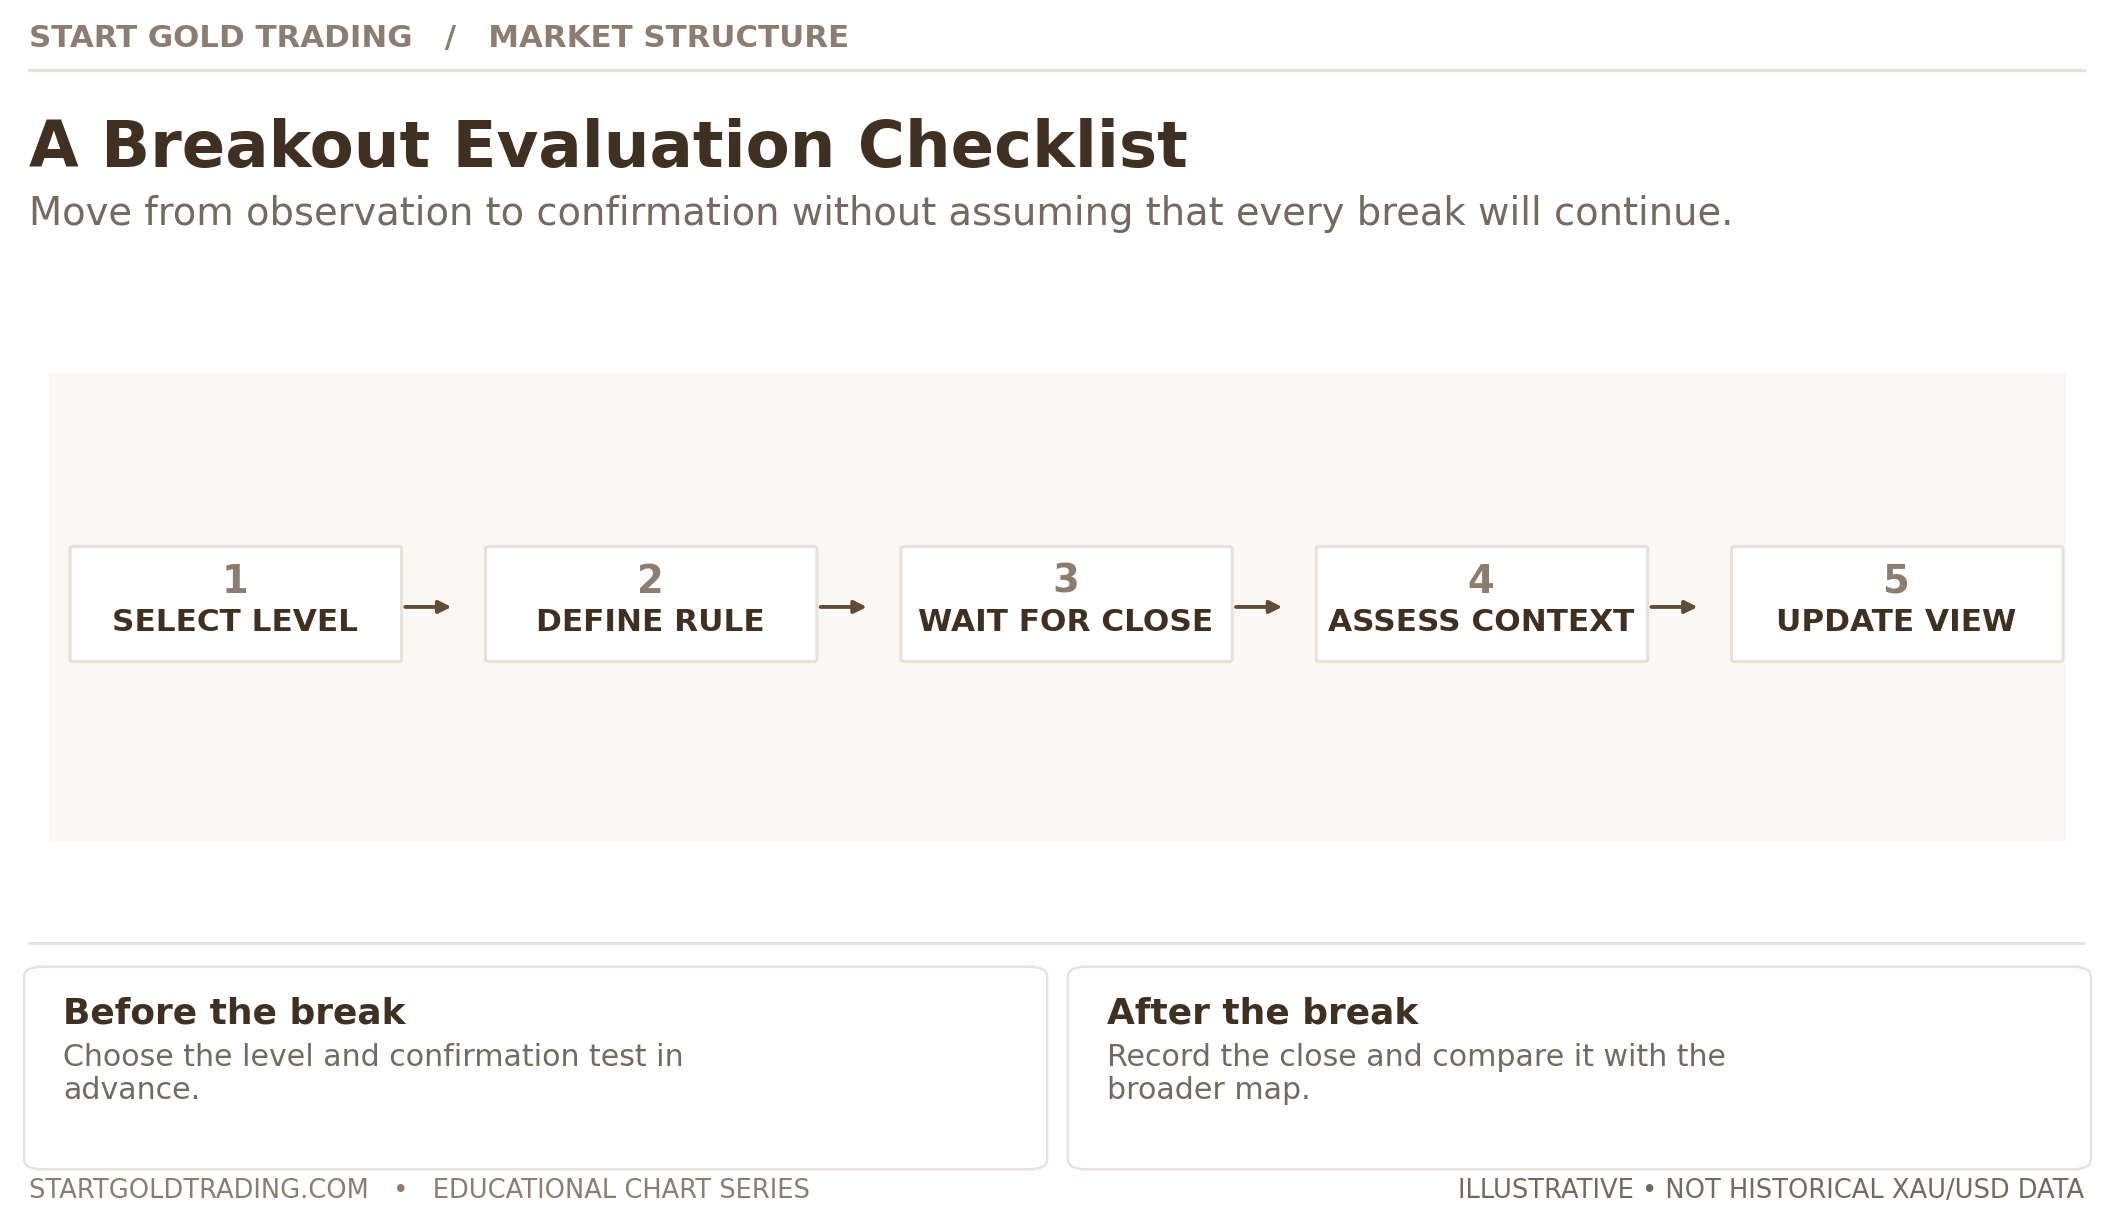
You now know enough to read a chart without covering it in labels. Use the following five questions as a short pre-analysis routine. The same observations can later support a more complete gold trading plan.
1. What is the main direction? Say “rising,” “falling,” “ranging” or “unclear.” You do not need to invent a confident answer.
2. Which two levels matter most? Mark the relevant swing high and swing low on the timeframe you are studying. Keep the selection rule consistent.
3. Is the current move with or against that direction? A decline inside a broader uptrend may be a correction. A rally inside a downtrend may be a bounce.
4. Did price break the important level, and how? Distinguish a wick beyond the level from your chosen close-based or other confirmation rule. Remember that a close beyond a level can also fail.
5. What would change my view? Identify the price behaviour that would invalidate your interpretation. If you cannot answer, you may not understand the structure well enough to act on it.
Three mistakes worth avoiding
Mistake one: calling every small dip a reversal. Zoom out and check whether the relevant larger swing boundary has actually changed.
Mistake two: treating a wick as proof. A price probe beyond a level is an observation; sustained follow-through is a different observation. Write your break criteria in advance.
Mistake three: rewriting your analysis after the result. A historical chart makes its best turning points look obvious. In real time, the later candles were not available yet. Mark decisions as provisional until your own confirmation rule has been met.
A useful chart note is plain and specific: “The H1 structure is still rising. The M5 chart is correcting lower. I will reassess the larger view if the chosen H1 swing low is broken under my close-based rule.” That explains more than a screen full of arrows.
7. Practise before you trade
Market structure is learned by repetition, not memorising twenty abbreviations. Try this simple exercise on the chart below before revealing the accompanying answer.
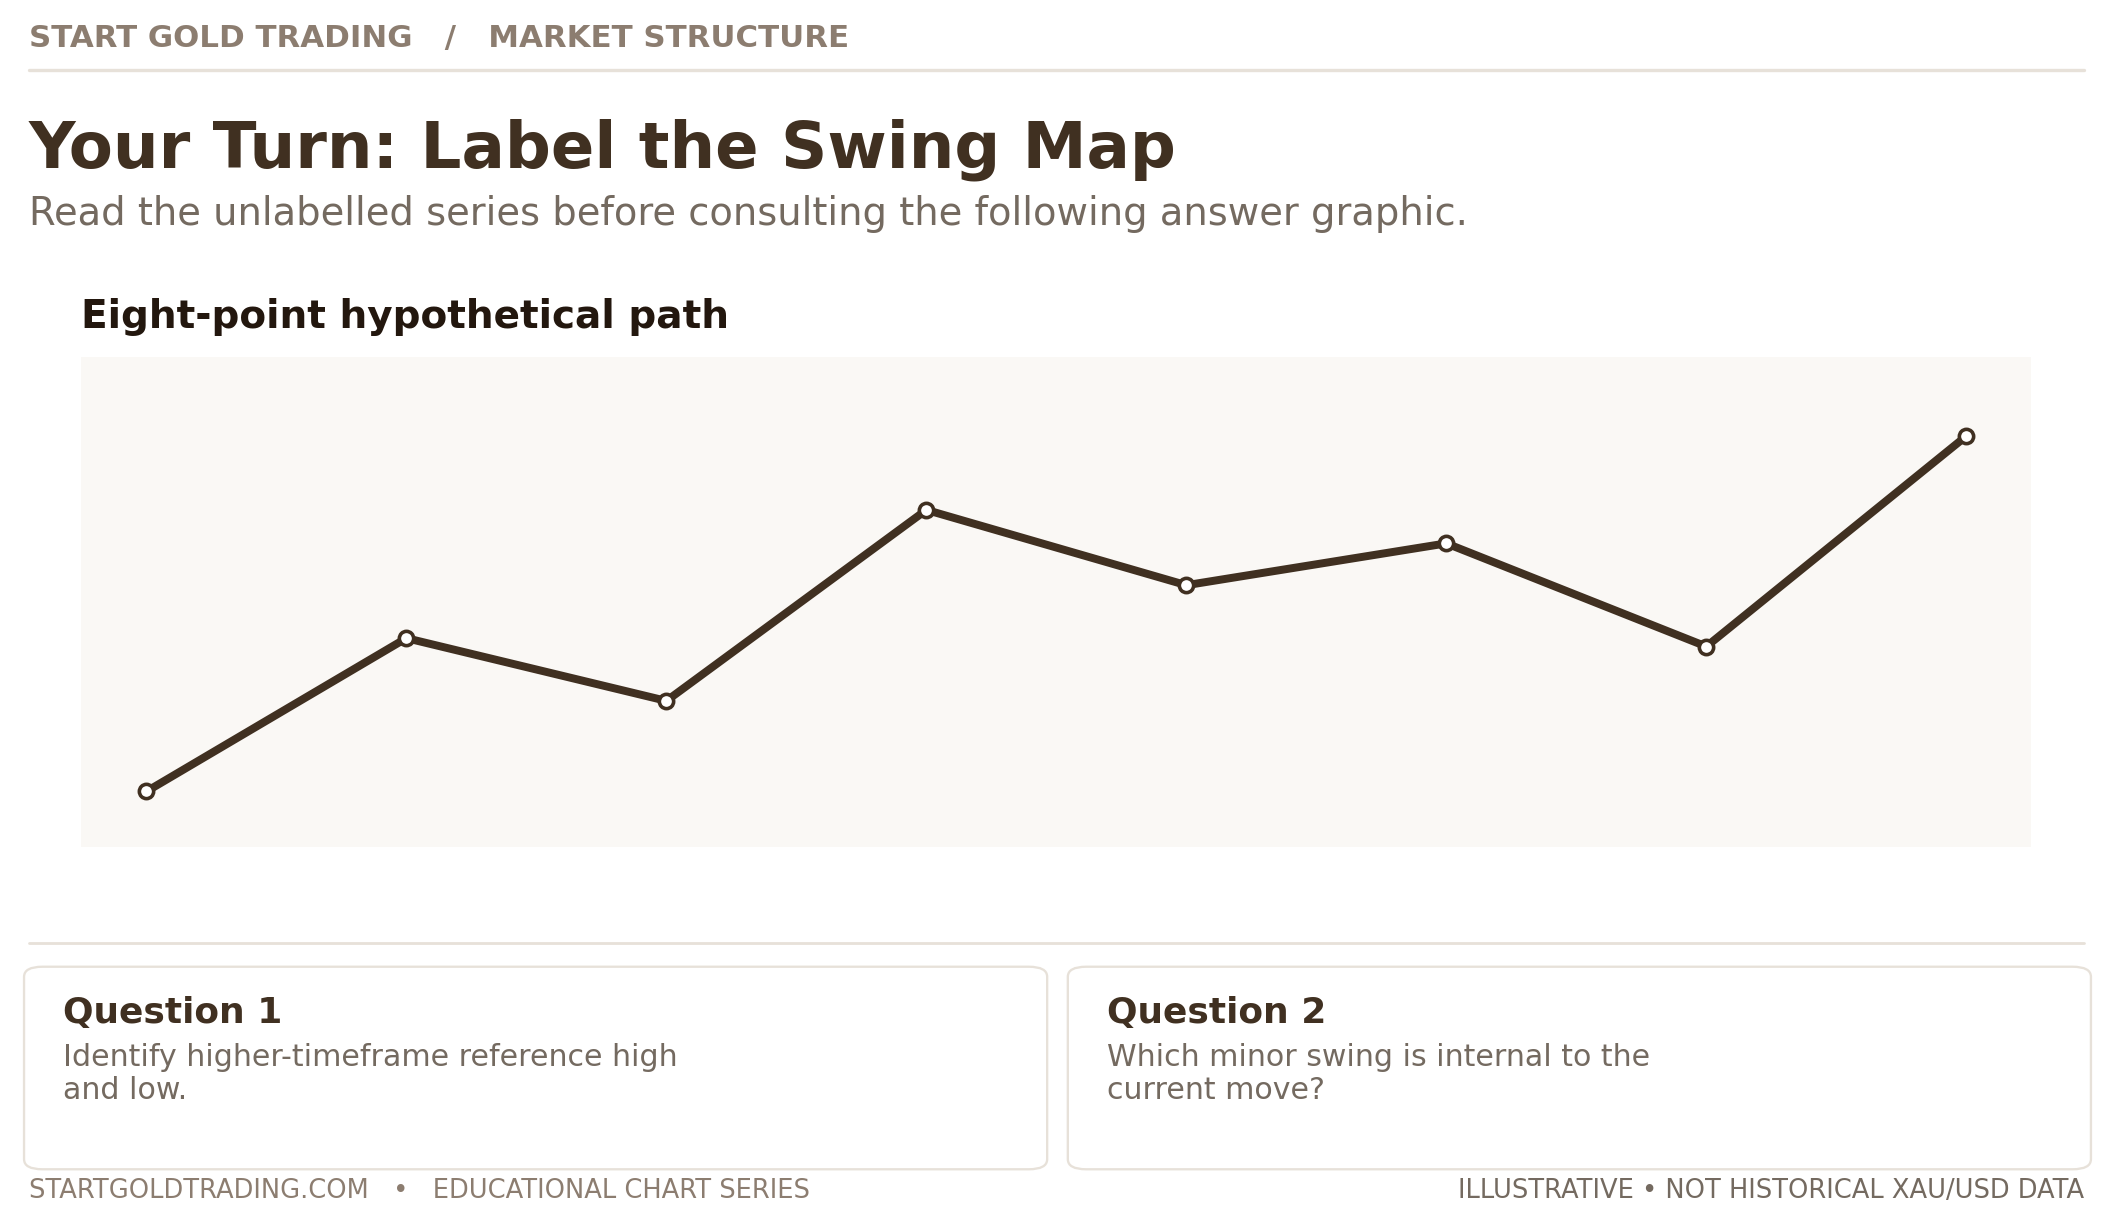
Pause and answer: Is the broad movement rising or falling? Where is its most relevant recent low? Which smaller dips would you call pullbacks? If the next segment moved lower, which level would make you reconsider your answer?
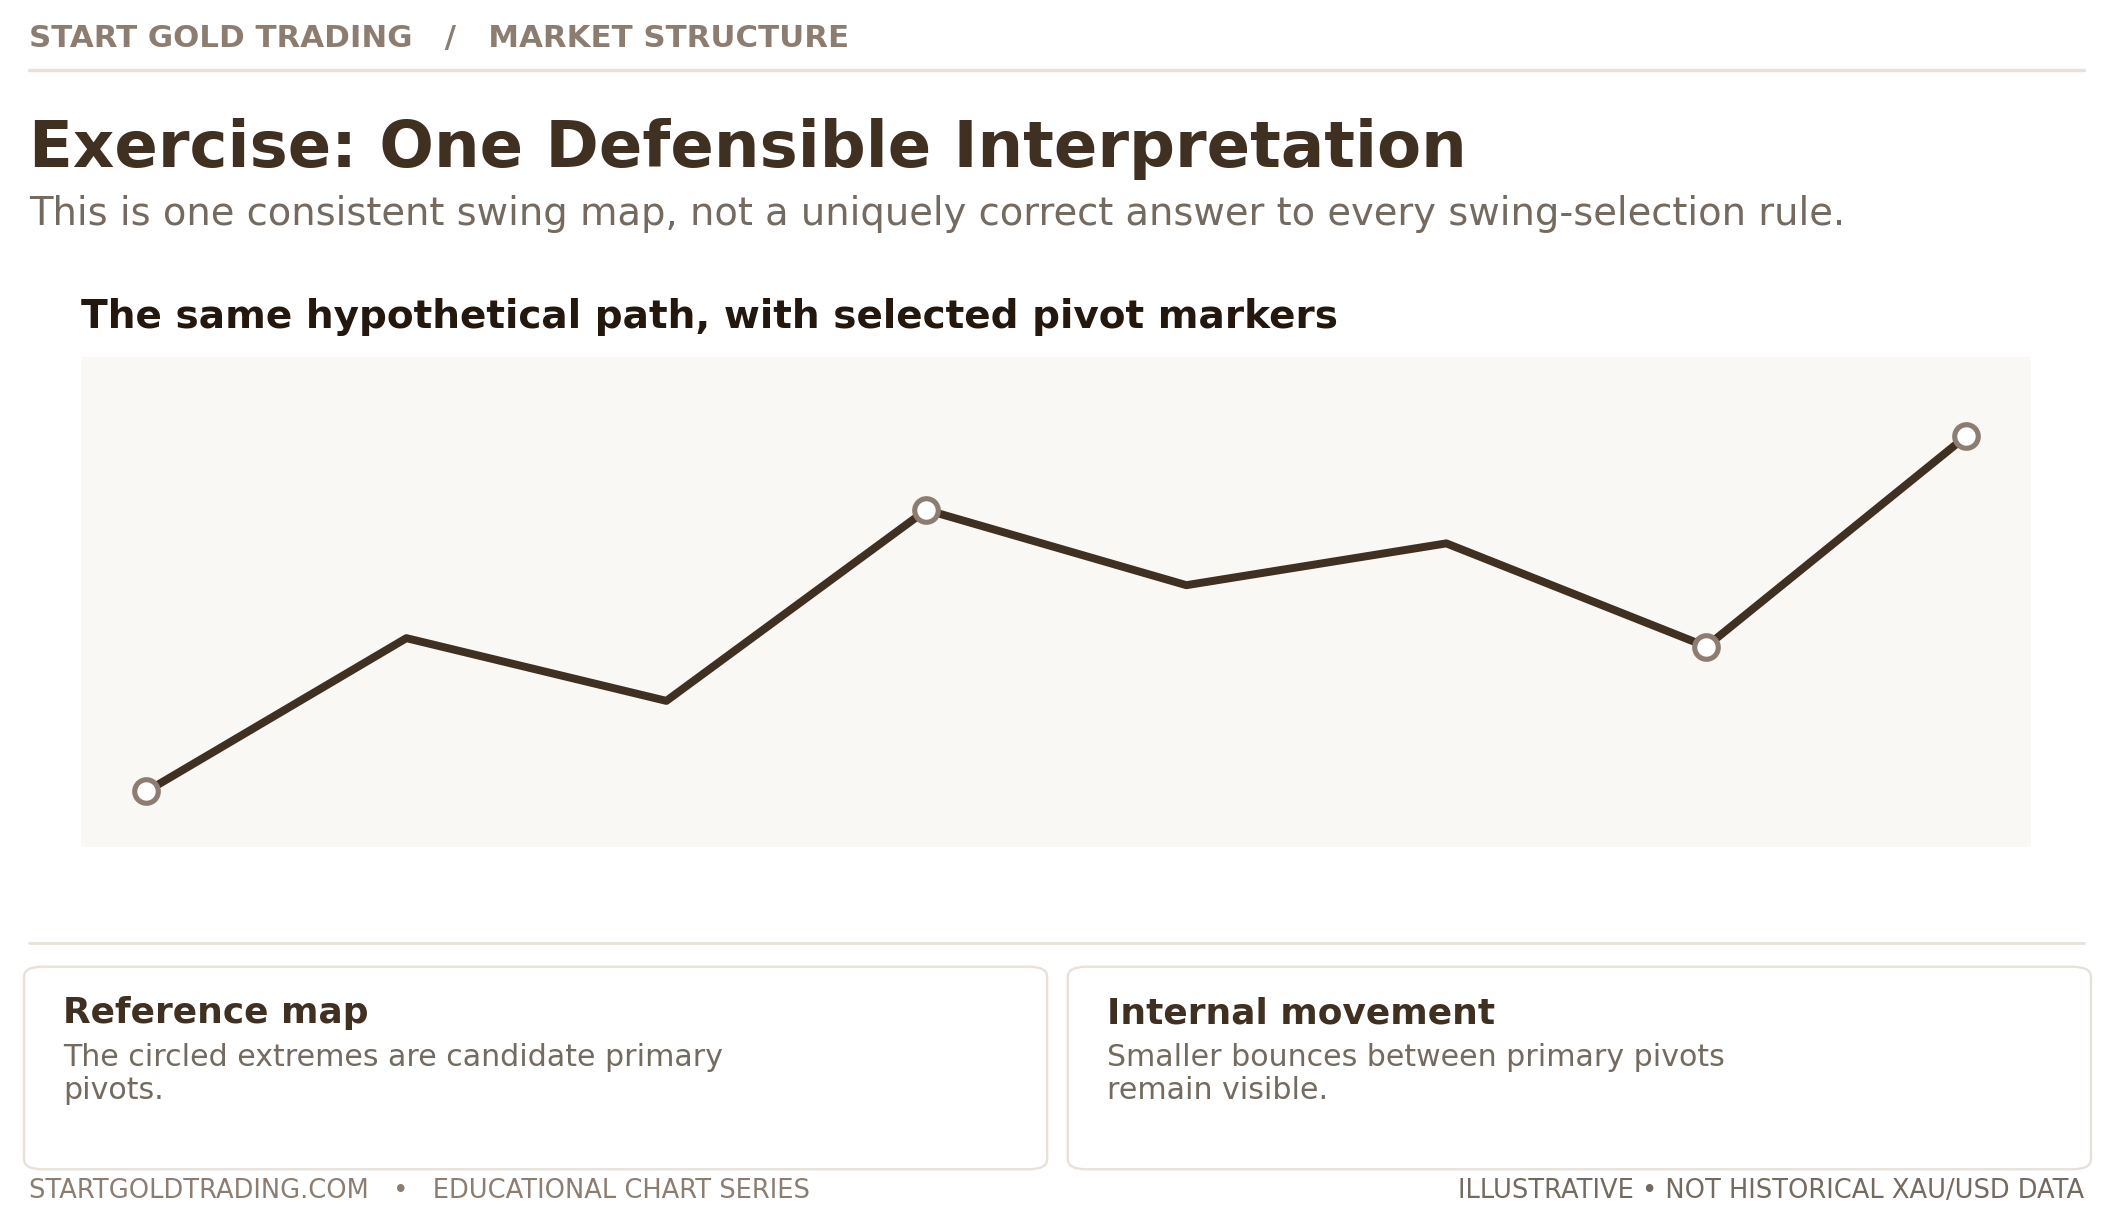
The answer illustration shows one defensible reading, not the only possible set of swing labels. Another trader using a clearly different swing-selection rule might draw a different map. What matters is whether the method is consistent and whether it relies on information that was available at the time.
For more practice, open a historical XAU/USD chart and cover the candles to the right of a chosen starting point. Reveal new candles a few at a time. Each time, write one sentence about what the chart currently shows and one sentence about what would change your view. This is a better beginner exercise than trying to guess every next candle.
Gold-specific practice: examine a real Federal Reserve announcement
Instead of learning only from diagrams, try observing an actual dated gold-market event. The Federal Reserve released its 28 October 2026 FOMC statement at 2:00 p.m. US Eastern time, equivalent to 2:00 a.m. on 29 October in Singapore. The announcement time is verified; no historical gold price path is supplied or implied in this exercise.
Open historical XAU/USD candles from a provider that clearly identifies its price source and timezone. Use the same provider and timeframe throughout. Before looking at later candles, mark an hour of price activity preceding the announcement. Write down your swing-point rule, the larger trend and what evidence would change your interpretation. Then advance the chart one candle at a time rather than jumping straight to the final result.
| Record this | Why it matters | What it does not establish |
|---|---|---|
| Price source and timeframe | Different feeds, sessions and candle sizes can create different swing labels | That one chart represents every gold contract or provider |
| Highest and lowest pre-release swings | Gives your analysis a defined reference point before hindsight takes over | That either reference will hold or break predictably |
| Post-release wick versus close | Distinguishes a brief probe from a move meeting your stated confirmation rule | That a breakout or reversal will become profitable |
| Spread, gap and execution assumptions | Shows why a chart-only conclusion may not equal a tradeable result | That a hypothetical fill would have been available in a real account |
Ask yourself: Did your interpretation change when you zoomed from the 15-minute chart to the one-hour chart? Would the same observation be described differently on a COMEX gold futures chart? If you cannot obtain reliable historical bid/ask spreads, say so rather than inventing execution costs.
This matters for gold specifically: CME Group explains that gold trading can become volatile around significant economic announcements and that liquidity and bid–offer spreads affect slippage. COMEX futures are an exchange-traded product, while a retail XAU/USD CFD is a separate contract with its provider. MoneySense explains the distinct margin and loss risks of CFDs. Do not treat a historical futures quote, a spot reference price and a CFD execution quote as interchangeable observations.
What this exercise teaches: A dated real-world chart can test whether you can apply consistent descriptive rules. It cannot, by itself, show that those rules offer a statistically reliable trading edge. A complete evaluation needs a broader, predefined sample and all relevant costs.
Continue learning: Review the gold risk-management worksheet and the guide to the economic data that moves gold.
8. The terms worth remembering
You do not need an enormous glossary. These are enough to understand the core ideas:
Swing high / swing low: A local turning point in price.
Higher high (HH) / higher low (HL): A peak or pullback low higher than a comparable previous swing.
Lower high (LH) / lower low (LL): A peak or trough lower than a comparable previous swing.
Trend: A directional sequence of meaningful swings.
Range: A market moving between broadly similar boundaries without a clear directional advance.
Retracement / pullback: Movement against the currently observed trend.
Break of structure (BOS): A label some traders use when a relevant swing level is broken, often in the prevailing direction.
Change of character (CHoCH): A trader-defined label for a possible change in structural direction. Its precise meaning varies.
Primary structure / internal structure: The larger swing pattern versus smaller swings inside it.
Common questions
Is market structure a trading strategy? No. It is a way of describing price movement. A complete strategy would need separate rules for timing, exposure, losses and evaluation.
Which timeframe should a beginner use? There is no universally best one. A practical exercise is to compare H4 with H1, then inspect M15 only if it helps. The point is to see how the same movement can be interpreted at different scales.
Does a BOS mean the trade will succeed? No. Price can break a level and then reverse. The label alone does not establish a profitable opportunity.
Can a lower low exist during an uptrend? Yes, on a smaller scale. The relevant question is whether the low belongs to the internal correction or breaks the larger swing you are using to define the trend.
Must I learn every advanced term? No. Start with direction, important swing points, confirmation and invalidation. Most advanced labels are shorter names for these observations.
The one idea to remember
A small reversal is not automatically a big reversal. Before declaring that gold has changed direction, identify the timeframe, mark the relevant swing high and low, and ask which boundary has actually been broken. If your interpretation is not yet confirmed, it is fine to say so.
Market structure will not tell you what the next candle must do. Its real value is helping you read gold price movements more clearly, make fewer assumptions and recognise when you need to rethink your analysis.
Educational information only. All diagrams and hypothetical prices are teaching examples, not historical trade records or verified profitable signals. Gold trading, particularly through leveraged products, carries material risk.
Related reading: How to Trade Gold in Forex: XAU/USD Basics.