
Day trading gold means opening and closing a gold exposure within a trading day, usually to study or speculate on short-term price fluctuations. It is a speculative activity rather than a predictable route to income. Beginners should start by understanding the product’s quote, lot size, executable spread and possible adverse fills before considering indicator strategies.
At a glance · Estimated reading time: 4–5 minutes
- A favourable chart movement does not necessarily produce a positive net trade.
- Spreads, commissions and imperfect fills can exceed the gross price movement.
- A clear no-trade rule can be more useful than an extra signal.
Day trading is a holding period, not a strategy
A trader might use breakout, range or momentum hypotheses during a single session. Each needs exact rules for identifying a setup and cancelling it. A market rise following an indicator crossover does not prove that the crossover works; assessing the method requires all qualifying events, including failures, measured after costs.
What a retail gold CFD order means
A CFD involves a contractual trade with a provider. You typically do not receive bars or coins, and execution can depend on the provider’s bid/ask quotations. A price shown on a TradingView or exchange-futures chart is not necessarily the price at which your broker would fill a CFD. MoneySense explains CFDs and margin risks.
How trading costs affect a short price move
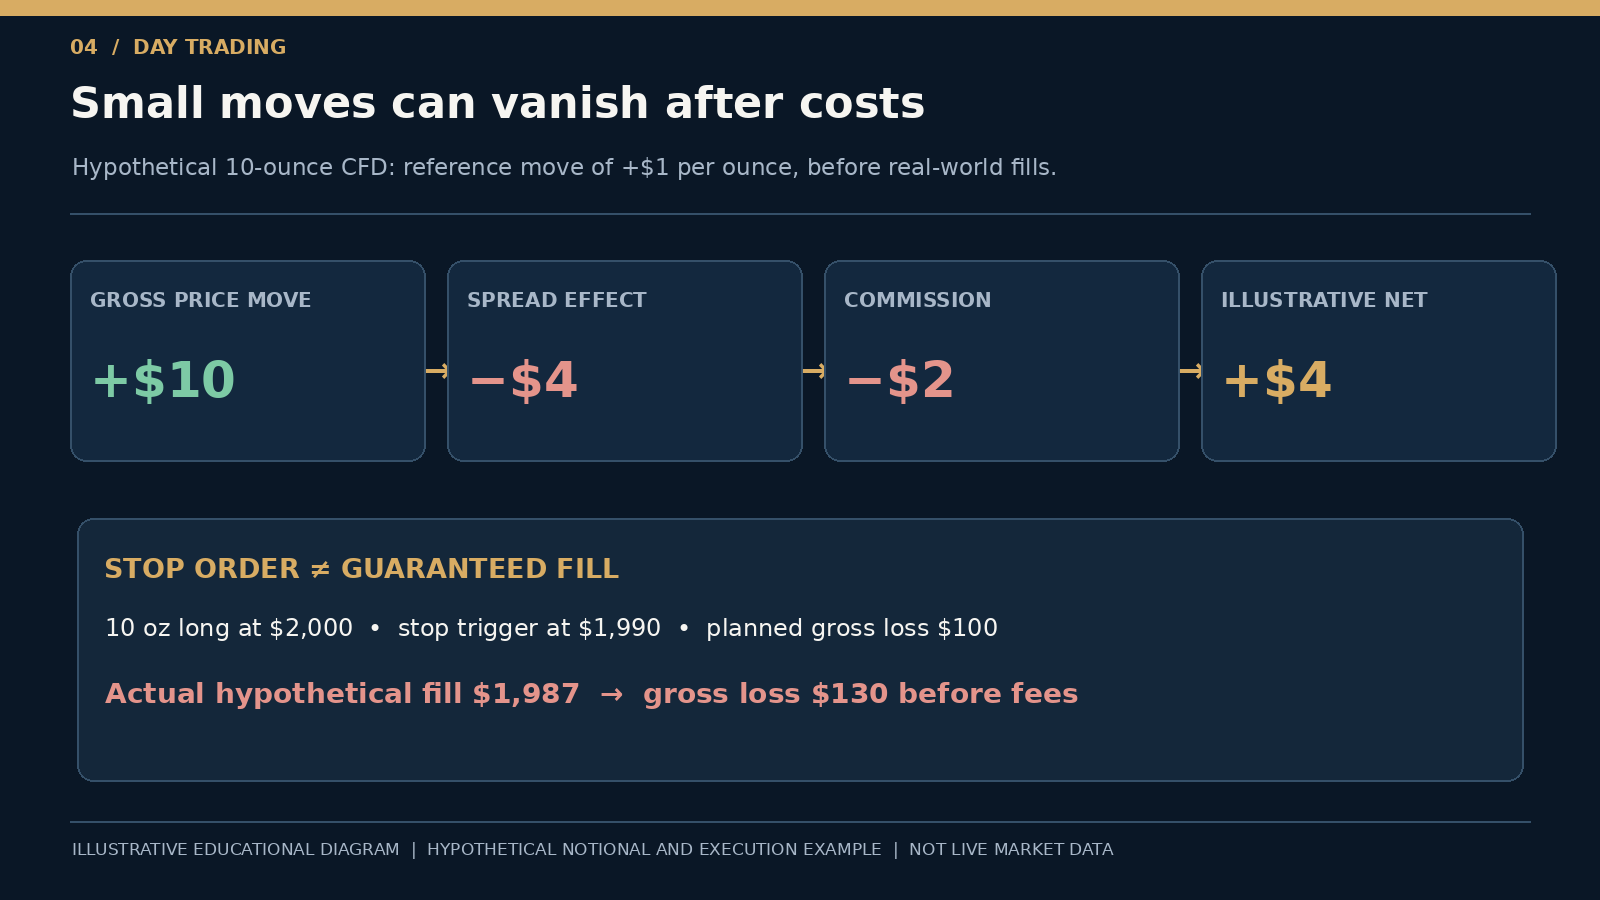
Assume an entirely hypothetical 10-ounce position and a favourable gold price change of $1 per ounce measured on a reference mid-price. That gives $10 gross reference movement. If the combined round-trip spread effect is $4 and commissions total $2, the illustrative result is +$4 net. Real providers may use different quotes or cost structures.
| Step | Illustrative result |
|---|---|
| 10 oz × +$1/oz movement | +$10 gross reference movement |
| Round-trip spread impact | −$4 |
| Total commissions | −$2 |
| Net result | +$4 |
If the same reference price moves −$1 per ounce, the illustrative gross movement is −$10 and, with identical trading charges, net becomes −$16. Increased trading frequency repeats costs; a visually small scalp can be unprofitable even when the market moves favourably.
A planned stop can be exceeded
If ten ounces are opened long at $2,000/oz and the stop trigger is $1,990/oz, the planned gross risk at the trigger is $100. If the actual exit is $1,987/oz, the gross loss is $130 before fees. A stop does not guarantee its trigger is the final fill, particularly around news and market gaps.
Chart signals need precise rules
- Moving averages: describe smoothed past prices; crossover tests may suffer whipsaws in ranges.
- RSI and MACD: summarise momentum and may remain extreme or turn late.
- Breakout levels: depend on prior chosen ranges and can generate false moves.
- News events: can increase volatility and execution risk; it may be reasonable not to trade.
A simple test-before-trading routine
- Identify the exact broker, instrument, quote side and ounces per lot.
- Define a completed-candle rule without using later bars to choose entry levels.
- List no-trade conditions, including excessive spread and relevant CPI releases.
- Calculate notional exposure and the planned dollar effect of a move.
- Test all instances net of spread, commissions, finance and slippage.
- Practise platform operation without assuming simulated fills predict live execution.
Why more trades do not equal more opportunities
Trading frequency raises transaction costs and may increase the chance of emotionally reactive decisions. The official BLS release calendar can help identify scheduled news risk. A trading journal should record full executed results and deliberate no-trade decisions, not simply winners.
Practice: when does a favourable move still lose money?
Use the earlier hypothetical 10-ounce gold position. The reference price rises by $0.30 per ounce, the assumed round-trip spread impact is $4, and total commissions are $2. These are made-up teaching figures, not a live broker price.
Reveal 1 — Calculate the outcome after trading costs
Gross reference movement is 10 × $0.30 = +$3. Subtract $4 of spread impact and $2 of commissions: $3 − $4 − $2 = −$3 net. The reference chart moved in the expected direction, but the illustrative trade lost money.
Reveal 2 — What reference move merely covers the assumed $6 costs?
The costs total $6. On 10 ounces, the required favourable move is $6 ÷ 10 = $0.60 per ounce for an illustrative $0 result before any other charges or slippage. This is arithmetic, not an expected move.
Reveal 3 — What changes if the spread impact rises to $8?
With the same $2 commissions, assumed costs would total $10. A 10-ounce position would need $10 ÷ 10 = $1.00 per ounce in favourable reference movement just to cover those costs, ignoring additional execution effects.
For a no-trade practice journal, distinguish three things: the reference chart movement, the provider’s actual executable bid and ask quotes, and the realised result after all charges. Never assume a chart quote or stop trigger was an available fill.
Key takeaway
Intraday gold charts offer information about past prices. Day trading remains risky, and an outcome depends on execution quality, costs and an independently evaluated process—not the number of candles watched.
Continue learning
References
- MoneySense — Understanding Contracts for Difference
- BLS — Consumer Price Index Calendar
- CME — Gold Futures Specifications
- CME — Technical Analysis
Educational information only. All numerical examples are hypothetical, not historical or current quotes. Neither trading strategies nor stop orders guarantee profit or a fixed loss ceiling. Leveraged products can cause substantial losses.